

this steep and diel-fluctuating redox boundary as a hotspot where cooperative
symbioses between microbes with O 2 -tolerant and anoxic metabolisms may have
given origin to the eukaryotic cell in the late Archaean (Nisbet and Fowler 1999).
Figure 3.3b shows the particle size distributions of siliciclastic sediments for the
topmost 10 mm of the microbial mat depicted on top. The pattern represents a
bimodal distribution with a peak abundance for silt (40–50 μm) and a right tail of
very fine to fine sand (60–200 μm). Cyanobacteria prefer fine sandy sediment as
substrates for the formation of microbial mats (Watermann et al. 1999; Stal 2003).
On the other hand, fine silt sediments with adsorbed nutrients are preferentially
colonized by diatoms (Stal 2003; Stal 2010), which present elevated growth rates
and outcompete cyanobacteria when nutrients are high. Despite having low nutrient
demands, cyanobacteria-dominated microbial mats can fix atmospheric N 2 independent of having heterocystous (e.g., Calothrix sp.) or non-heterocystous representatives among the cyanobacterial assemblage (Stal 2003; Stal 2012), by virtue of genes
acquired through horizontal gene transfer processes (Bolhuis et al. 2010).
Microbial mats grow by accumulation of mat-derived organic matter buried in
anoxic layers (Gerdes 2007) and by sediment accretion. A large proportion of the
organic matter derives from the accumulation of colloidal exopolymers and empty
cyanobacterial sheaths, the latter being recalcitrant to chemical and microbial
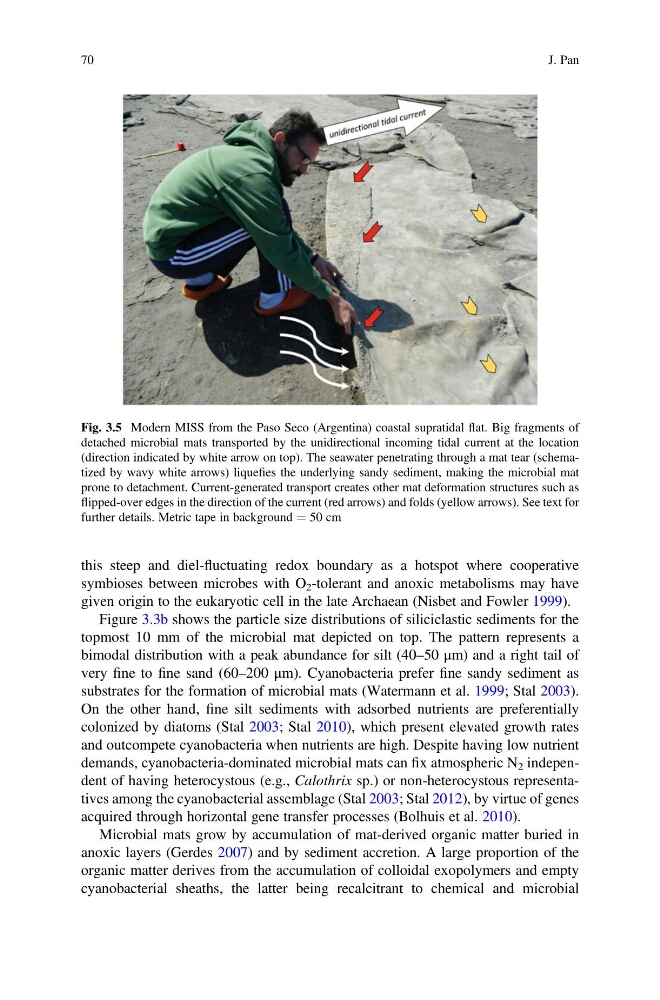
Fig. 3.5 Modern MISS from the Paso Seco (Argentina) coastal supratidal flat. Big fragments of
detached microbial mats transported by the unidirectional incoming tidal current at the location
(direction indicated by white arrow on top). The seawater penetrating through a mat tear (schematized by wavy white arrows) liquefies the underlying sandy sediment, making the microbial mat
prone to detachment. Current-generated transport creates other mat deformation structures such as
flipped-over edges in the direction of the current (red arrows) and folds (yellow arrows). See text for
further details. Metric tape in background ¼ 50 cm
70
J. Pan
symbioses between microbes with O 2 -tolerant and anoxic metabolisms may have
given origin to the eukaryotic cell in the late Archaean (Nisbet and Fowler 1999).
Figure 3.3b shows the particle size distributions of siliciclastic sediments for the
topmost 10 mm of the microbial mat depicted on top. The pattern represents a
bimodal distribution with a peak abundance for silt (40–50 μm) and a right tail of
very fine to fine sand (60–200 μm). Cyanobacteria prefer fine sandy sediment as
substrates for the formation of microbial mats (Watermann et al. 1999; Stal 2003).
On the other hand, fine silt sediments with adsorbed nutrients are preferentially
colonized by diatoms (Stal 2003; Stal 2010), which present elevated growth rates
and outcompete cyanobacteria when nutrients are high. Despite having low nutrient
demands, cyanobacteria-dominated microbial mats can fix atmospheric N 2 independent of having heterocystous (e.g., Calothrix sp.) or non-heterocystous representatives among the cyanobacterial assemblage (Stal 2003; Stal 2012), by virtue of genes
acquired through horizontal gene transfer processes (Bolhuis et al. 2010).
Microbial mats grow by accumulation of mat-derived organic matter buried in
anoxic layers (Gerdes 2007) and by sediment accretion. A large proportion of the
organic matter derives from the accumulation of colloidal exopolymers and empty
cyanobacterial sheaths, the latter being recalcitrant to chemical and microbial
Fig. 3.5 Modern MISS from the Paso Seco (Argentina) coastal supratidal flat. Big fragments of
detached microbial mats transported by the unidirectional incoming tidal current at the location
(direction indicated by white arrow on top). The seawater penetrating through a mat tear (schematized by wavy white arrows) liquefies the underlying sandy sediment, making the microbial mat
prone to detachment. Current-generated transport creates other mat deformation structures such as
flipped-over edges in the direction of the current (red arrows) and folds (yellow arrows). See text for
further details. Metric tape in background ¼ 50 cm
70
J. Pan