

In particular:
1. Control in the literature which is the functional quaternary
structure of that specific protein/enzyme;
2. Once the crystallographic file has been uploaded in the protein
data
bank
server
(http://www.rcsb.org/pdb/home/
home.do), check whether the preferential quaternary structure
composition corresponds to that observed for biological function (step 1);
3. Check the number of a.a. included in the PDB file: sometimes
crystallization is possible only for a segment and not for the
entire, natural polypeptide length;
4. Use the PISA software to analyze the dimer interface (http://
www.ebi.ac.uk/pdbe/pisa/). This interactive software
(provided in the Protein Data Bank server) checks in the PDB
file for the presence of multiple chains, through the “assemblies” option. In the case that more than two chains are present, it provides information on the best combination to form
the dimer: for instance, if four homologous chains are present
(say A, B, C, and D), and the couple AC scores 1, it means that
AC is the most probable (and thus reliable) quaternary structure representing the real protein.
5. Download the file that at step 4 the PISA routine recognized as
the most reliable (in the example mentioned, AC).
6. Enter in “Details” to get the list of a.a. lying at the interface and
their position in the primary structure. In this section of the
program other interesting parameters are listed, such as the
overall area of the protein surface, the area buried upon dimerization, the number of a.a. at the interface, etc.
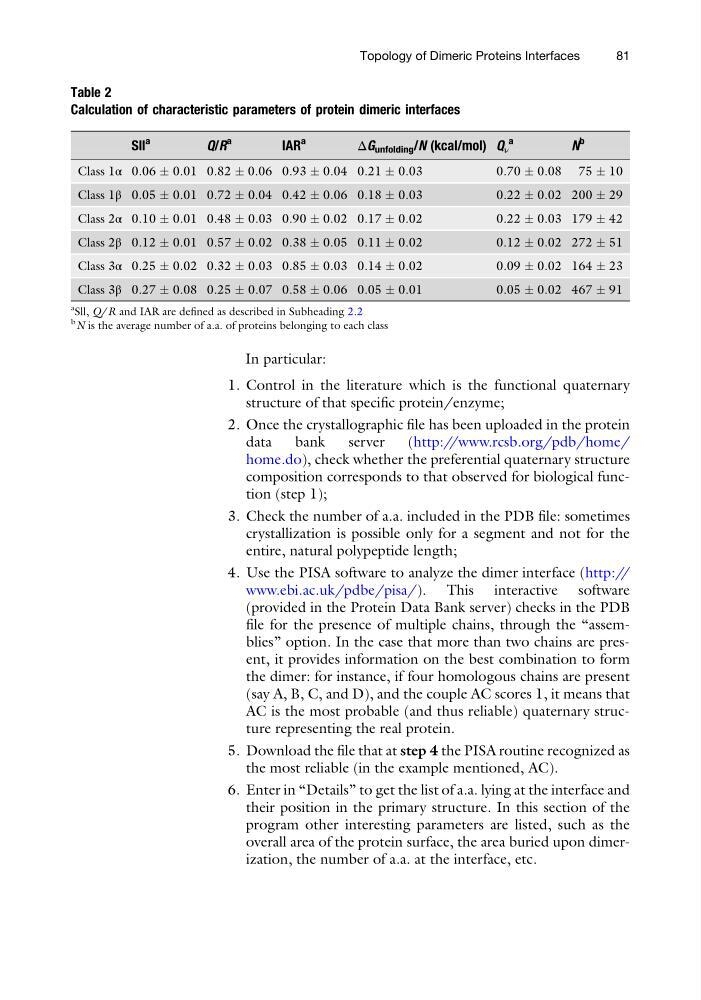
Table 2
Calculation of characteristic parameters of protein dimeric interfaces
Sll
a
Q/R
a
IAR
a
ΔG unfolding /N (kcal/mol) Q ν
a
N
b
Class 1α 0.06 Æ 0.01 0.82 Æ 0.06 0.93 Æ 0.04 0.21 Æ 0.03
0.70 Æ 0.08 75 Æ 10
Class 1β 0.05 Æ 0.01 0.72 Æ 0.04 0.42 Æ 0.06 0.18 Æ 0.03
0.22 Æ 0.02 200 Æ 29
Class 2α 0.10 Æ 0.01 0.48 Æ 0.03 0.90 Æ 0.02 0.17 Æ 0.02
0.22 Æ 0.03 179 Æ 42
Class 2β 0.12 Æ 0.01 0.57 Æ 0.02 0.38 Æ 0.05 0.11 Æ 0.02
0.12 Æ 0.02 272 Æ 51
Class 3α 0.25 Æ 0.02 0.32 Æ 0.03 0.85 Æ 0.03 0.14 Æ 0.02
0.09 Æ 0.02 164 Æ 23
Class 3β 0.27 Æ 0.08 0.25 Æ 0.07 0.58 Æ 0.06 0.05 Æ 0.01
0.05 Æ 0.02 467 Æ 91
a
Sll, Q/R and IAR are defined as described in Subheading 2.2
b
N is the average number of a.a. of proteins belonging to each class
Topology of Dimeric Proteins Interfaces
81
1. Control in the literature which is the functional quaternary
structure of that specific protein/enzyme;
2. Once the crystallographic file has been uploaded in the protein
data
bank
server
(http://www.rcsb.org/pdb/home/
home.do), check whether the preferential quaternary structure
composition corresponds to that observed for biological function (step 1);
3. Check the number of a.a. included in the PDB file: sometimes
crystallization is possible only for a segment and not for the
entire, natural polypeptide length;
4. Use the PISA software to analyze the dimer interface (http://
www.ebi.ac.uk/pdbe/pisa/). This interactive software
(provided in the Protein Data Bank server) checks in the PDB
file for the presence of multiple chains, through the “assemblies” option. In the case that more than two chains are present, it provides information on the best combination to form
the dimer: for instance, if four homologous chains are present
(say A, B, C, and D), and the couple AC scores 1, it means that
AC is the most probable (and thus reliable) quaternary structure representing the real protein.
5. Download the file that at step 4 the PISA routine recognized as
the most reliable (in the example mentioned, AC).
6. Enter in “Details” to get the list of a.a. lying at the interface and
their position in the primary structure. In this section of the
program other interesting parameters are listed, such as the
overall area of the protein surface, the area buried upon dimerization, the number of a.a. at the interface, etc.
Table 2
Calculation of characteristic parameters of protein dimeric interfaces
Sll
a
Q/R
a
IAR
a
ΔG unfolding /N (kcal/mol) Q ν
a
N
b
Class 1α 0.06 Æ 0.01 0.82 Æ 0.06 0.93 Æ 0.04 0.21 Æ 0.03
0.70 Æ 0.08 75 Æ 10
Class 1β 0.05 Æ 0.01 0.72 Æ 0.04 0.42 Æ 0.06 0.18 Æ 0.03
0.22 Æ 0.02 200 Æ 29
Class 2α 0.10 Æ 0.01 0.48 Æ 0.03 0.90 Æ 0.02 0.17 Æ 0.02
0.22 Æ 0.03 179 Æ 42
Class 2β 0.12 Æ 0.01 0.57 Æ 0.02 0.38 Æ 0.05 0.11 Æ 0.02
0.12 Æ 0.02 272 Æ 51
Class 3α 0.25 Æ 0.02 0.32 Æ 0.03 0.85 Æ 0.03 0.14 Æ 0.02
0.09 Æ 0.02 164 Æ 23
Class 3β 0.27 Æ 0.08 0.25 Æ 0.07 0.58 Æ 0.06 0.05 Æ 0.01
0.05 Æ 0.02 467 Æ 91
a
Sll, Q/R and IAR are defined as described in Subheading 2.2
b
N is the average number of a.a. of proteins belonging to each class
Topology of Dimeric Proteins Interfaces
81