

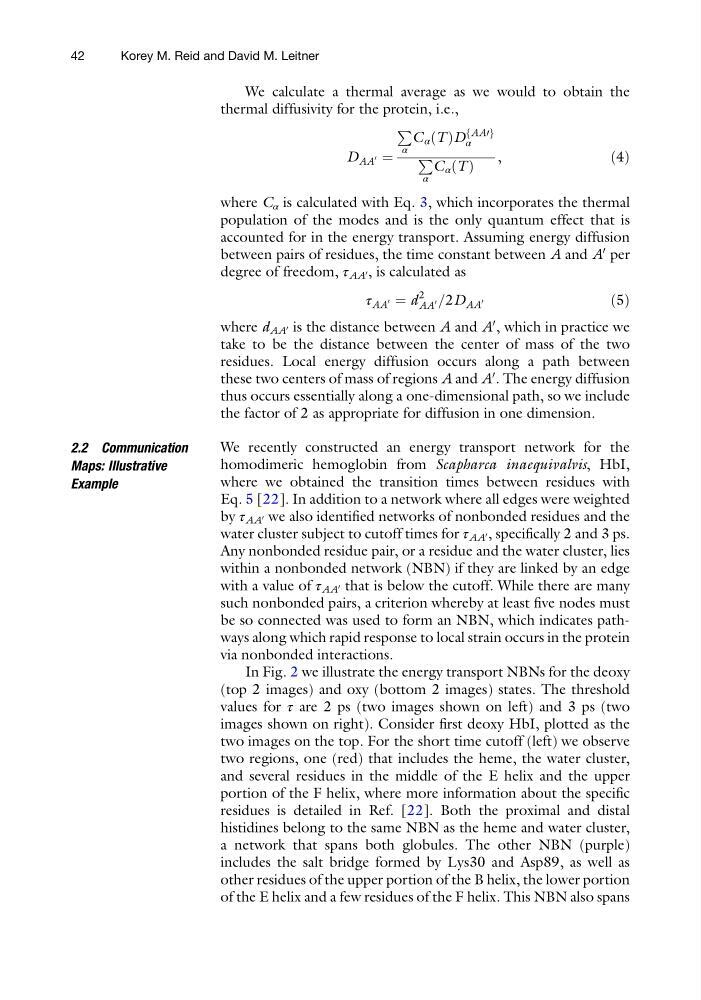
We calculate a thermal average as we would to obtain the
thermal diffusivity for the protein, i.e.,
D AA
0 ¼
P
α
C α T
ð ÞD
AA0
f
g
α
P
α
C α T
ð Þ
,
ð4Þ
where C α is calculated with Eq. 3, which incorporates the thermal
population of the modes and is the only quantum effect that is
accounted for in the energy transport. Assuming energy diffusion
between pairs of residues, the time constant between A and A
0 per
degree of freedom, τ AA
0 , is calculated as
τ AA
0 ¼ d
2
AA
0 =2D AA
0
ð5Þ
where d AA
0 is the distance between A and A
0 , which in practice we
take to be the distance between the center of mass of the two
residues. Local energy diffusion occurs along a path between
these two centers of mass of regions A and A
0 . The energy diffusion
thus occurs essentially along a one-dimensional path, so we include
the factor of 2 as appropriate for diffusion in one dimension.
2.2 Communication
Maps: Illustrative
Example
We recently constructed an energy transport network for the
homodimeric hemoglobin from Scapharca inaequivalvis, HbI,
where we obtained the transition times between residues with
Eq. 5 [22]. In addition to a network where all edges were weighted
by τ AA
0 we also identified networks of nonbonded residues and the
water cluster subject to cutoff times for τ AA
0 , specifically 2 and 3 ps.
Any nonbonded residue pair, or a residue and the water cluster, lies
within a nonbonded network (NBN) if they are linked by an edge
with a value of τ AA
0 that is below the cutoff. While there are many
such nonbonded pairs, a criterion whereby at least five nodes must
be so connected was used to form an NBN, which indicates pathways along which rapid response to local strain occurs in the protein
via nonbonded interactions.
In Fig. 2 we illustrate the energy transport NBNs for the deoxy
(top 2 images) and oxy (bottom 2 images) states. The threshold
values for τ are 2 ps (two images shown on left) and 3 ps (two
images shown on right). Consider first deoxy HbI, plotted as the
two images on the top. For the short time cutoff (left) we observe
two regions, one (red) that includes the heme, the water cluster,
and several residues in the middle of the E helix and the upper
portion of the F helix, where more information about the specific
residues is detailed in Ref. [22]. Both the proximal and distal
histidines belong to the same NBN as the heme and water cluster,
a network that spans both globules. The other NBN (purple)
includes the salt bridge formed by Lys30 and Asp89, as well as
other residues of the upper portion of the B helix, the lower portion
of the E helix and a few residues of the F helix. This NBN also spans
42
Korey M. Reid and David M. Leitner
thermal diffusivity for the protein, i.e.,
D AA
0 ¼
P
α
C α T
ð ÞD
AA0
f
g
α
P
α
C α T
ð Þ
,
ð4Þ
where C α is calculated with Eq. 3, which incorporates the thermal
population of the modes and is the only quantum effect that is
accounted for in the energy transport. Assuming energy diffusion
between pairs of residues, the time constant between A and A
0 per
degree of freedom, τ AA
0 , is calculated as
τ AA
0 ¼ d
2
AA
0 =2D AA
0
ð5Þ
where d AA
0 is the distance between A and A
0 , which in practice we
take to be the distance between the center of mass of the two
residues. Local energy diffusion occurs along a path between
these two centers of mass of regions A and A
0 . The energy diffusion
thus occurs essentially along a one-dimensional path, so we include
the factor of 2 as appropriate for diffusion in one dimension.
2.2 Communication
Maps: Illustrative
Example
We recently constructed an energy transport network for the
homodimeric hemoglobin from Scapharca inaequivalvis, HbI,
where we obtained the transition times between residues with
Eq. 5 [22]. In addition to a network where all edges were weighted
by τ AA
0 we also identified networks of nonbonded residues and the
water cluster subject to cutoff times for τ AA
0 , specifically 2 and 3 ps.
Any nonbonded residue pair, or a residue and the water cluster, lies
within a nonbonded network (NBN) if they are linked by an edge
with a value of τ AA
0 that is below the cutoff. While there are many
such nonbonded pairs, a criterion whereby at least five nodes must
be so connected was used to form an NBN, which indicates pathways along which rapid response to local strain occurs in the protein
via nonbonded interactions.
In Fig. 2 we illustrate the energy transport NBNs for the deoxy
(top 2 images) and oxy (bottom 2 images) states. The threshold
values for τ are 2 ps (two images shown on left) and 3 ps (two
images shown on right). Consider first deoxy HbI, plotted as the
two images on the top. For the short time cutoff (left) we observe
two regions, one (red) that includes the heme, the water cluster,
and several residues in the middle of the E helix and the upper
portion of the F helix, where more information about the specific
residues is detailed in Ref. [22]. Both the proximal and distal
histidines belong to the same NBN as the heme and water cluster,
a network that spans both globules. The other NBN (purple)
includes the salt bridge formed by Lys30 and Asp89, as well as
other residues of the upper portion of the B helix, the lower portion
of the E helix and a few residues of the F helix. This NBN also spans
42
Korey M. Reid and David M. Leitner