

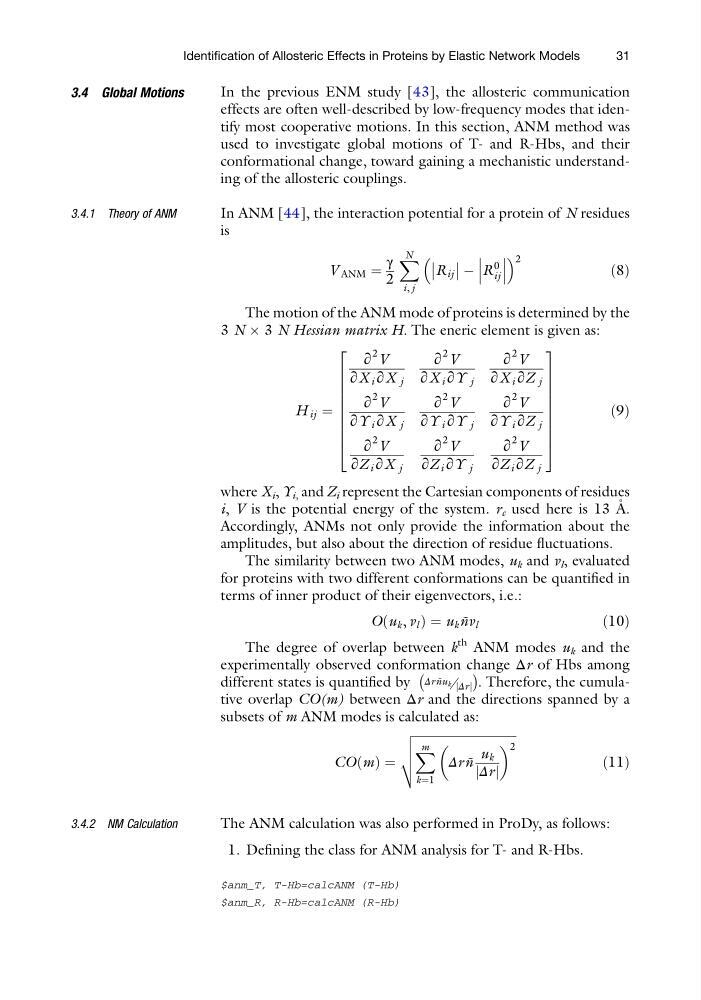
3.4 Global Motions
In the previous ENM study [43], the allosteric communication
effects are often well-described by low-frequency modes that identify most cooperative motions. In this section, ANM method was
used to investigate global motions of T- and R-Hbs, and their
conformational change, toward gaining a mechanistic understanding of the allosteric couplings.
3.4.1 Theory of ANM
In ANM [44], the interaction potential for a protein of N residues
is
V ANM ¼
γ
2
X N
i, j
R ij
À R
0
ij
2
ð8Þ
The motion of the ANM mode of proteins is determined by the
3 N Â 3 N Hessian matrix H. The eneric element is given as:
H ij ¼
∂
2 V
∂X i ∂X j
∂
2 V
∂X i ∂Y j
∂
2 V
∂X i ∂Z j
∂
2 V
∂Y i ∂X j
∂
2 V
∂Y i ∂Y j
∂
2 V
∂Y i ∂Z j
∂
2 V
∂Z i ∂X j
∂
2 V
∂Z i ∂Y j
∂
2 V
∂Z i ∂Z j
2
6
6
6
6
6
6
6
6
4
3
7
7
7
7
7
7
7
7
5
ð9Þ
where X i , Y i, and Z i represent the Cartesian components of residues
i, V is the potential energy of the system. r c used here is 13 A ˚ .
Accordingly, ANMs not only provide the information about the
amplitudes, but also about the direction of residue fluctuations.
The similarity between two ANM modes, u k and v l , evaluated
for proteins with two different conformations can be quantified in
terms of inner product of their eigenvectors, i.e.:
O u k , v l
ð
Þ¼u k ˜
nv l
ð10Þ
The degree of overlap between k
th ANM modes u k and the
experimentally observed conformation change Δr of Hbs among
different states is quantified by Δr ˜
nu k= Δr
j j
À
Á
. Therefore, the cumulative overlap CO(m) between Δr and the directions spanned by a
subsets of m ANM modes is calculated as:
CO m
ð Þ ¼
ffiffiffiffiffiffiffiffiffiffiffiffiffiffiffiffiffiffiffiffiffiffiffiffiffiffiffiffiffiffiffiffiffiffi
X m
k¼1
Δr ˜
n
u k
Δr
j j
2
v
u
u
t
ð11Þ
3.4.2 NM Calculation
The ANM calculation was also performed in ProDy, as follows:
1. Defining the class for ANM analysis for T- and R-Hbs.
$anm_T, T-Hb=calcANM (T-Hb)
$anm_R, R-Hb=calcANM (R-Hb)
Identification of Allosteric Effects in Proteins by Elastic Network Models
31
In the previous ENM study [43], the allosteric communication
effects are often well-described by low-frequency modes that identify most cooperative motions. In this section, ANM method was
used to investigate global motions of T- and R-Hbs, and their
conformational change, toward gaining a mechanistic understanding of the allosteric couplings.
3.4.1 Theory of ANM
In ANM [44], the interaction potential for a protein of N residues
is
V ANM ¼
γ
2
X N
i, j
R ij
À R
0
ij
2
ð8Þ
The motion of the ANM mode of proteins is determined by the
3 N Â 3 N Hessian matrix H. The eneric element is given as:
H ij ¼
∂
2 V
∂X i ∂X j
∂
2 V
∂X i ∂Y j
∂
2 V
∂X i ∂Z j
∂
2 V
∂Y i ∂X j
∂
2 V
∂Y i ∂Y j
∂
2 V
∂Y i ∂Z j
∂
2 V
∂Z i ∂X j
∂
2 V
∂Z i ∂Y j
∂
2 V
∂Z i ∂Z j
2
6
6
6
6
6
6
6
6
4
3
7
7
7
7
7
7
7
7
5
ð9Þ
where X i , Y i, and Z i represent the Cartesian components of residues
i, V is the potential energy of the system. r c used here is 13 A ˚ .
Accordingly, ANMs not only provide the information about the
amplitudes, but also about the direction of residue fluctuations.
The similarity between two ANM modes, u k and v l , evaluated
for proteins with two different conformations can be quantified in
terms of inner product of their eigenvectors, i.e.:
O u k , v l
ð
Þ¼u k ˜
nv l
ð10Þ
The degree of overlap between k
th ANM modes u k and the
experimentally observed conformation change Δr of Hbs among
different states is quantified by Δr ˜
nu k= Δr
j j
À
Á
. Therefore, the cumulative overlap CO(m) between Δr and the directions spanned by a
subsets of m ANM modes is calculated as:
CO m
ð Þ ¼
ffiffiffiffiffiffiffiffiffiffiffiffiffiffiffiffiffiffiffiffiffiffiffiffiffiffiffiffiffiffiffiffiffiffi
X m
k¼1
Δr ˜
n
u k
Δr
j j
2
v
u
u
t
ð11Þ
3.4.2 NM Calculation
The ANM calculation was also performed in ProDy, as follows:
1. Defining the class for ANM analysis for T- and R-Hbs.
$anm_T, T-Hb=calcANM (T-Hb)
$anm_R, R-Hb=calcANM (R-Hb)
Identification of Allosteric Effects in Proteins by Elastic Network Models
31