

implemented in Matlab. To follow this tutorial, you will need the
following execute files:
Cafrompdb.m: this is a function for reading a protein structure
from PDB file.
Graph.m: this is a function for transforming a protein structure
into a graph.
1. Start Matlab.
2. Copy cafrompdb.m and to Graph.m the work directory, and
use Cafrompdb.m and Graph.m to construct graphs from PDB
files, and type the flowing command lines in the Matlab
workspace.
$[G, A, C]=Graph(pdb_file, C, cutoff, pdb_path)
$ G = sparse (G);
G is a connected graph generated from the adjacent matrix (G),
in which each edge is weighted by commute time (C ij ).
3. Calculate shortest pathway using the Matlab built-in
functions.
$[dist, path, pred] = graphshortestpath(G, S, T)
For example, the pathway between Val62 in α1 chain to Asp94
α1 chain located at α 1 β 1 interface can be calculated as:
Input: [G,A,C]=Graph (‘2dn1.pdb’, ‘C_R.txt’, 7, ‘./’)
G=sparse(G);
[dist, path]=graphshortestpath (G, 62, 94)
Output: dist=5.6316e+03
path=62 25 28,104,101 97 94
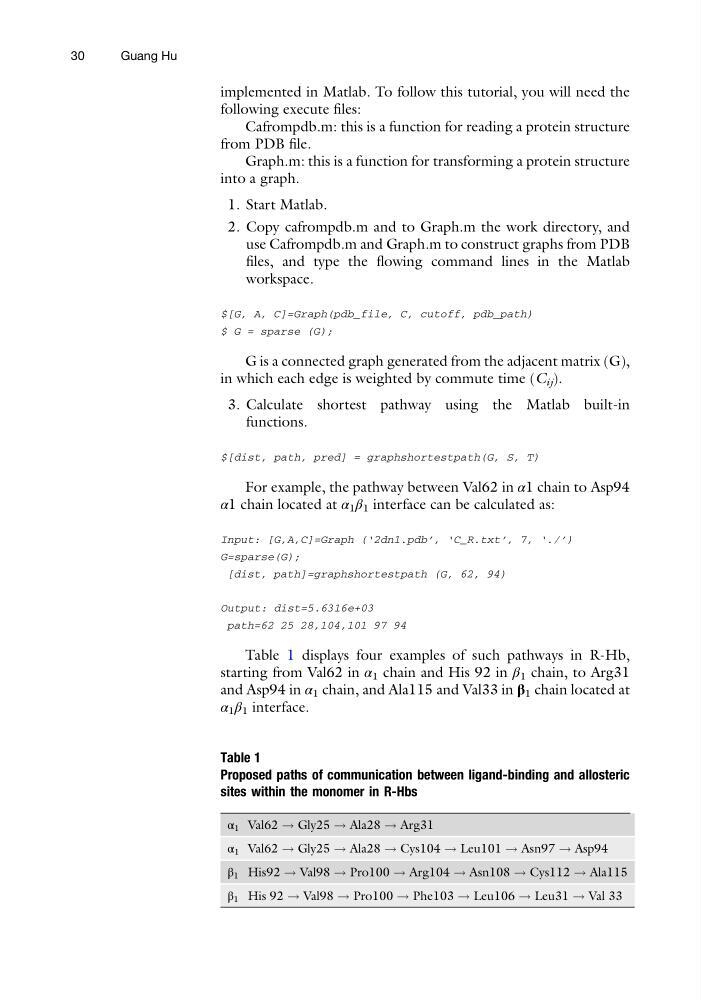
Table 1 displays four examples of such pathways in R-Hb,
starting from Val62 in α 1 chain and His 92 in β 1 chain, to Arg31
and Asp94 in α 1 chain, and Ala115 and Val33 in β 1 chain located at
α 1 β 1 interface.
Table 1
Proposed paths of communication between ligand-binding and allosteric
sites within the monomer in R-Hbs
α 1 Val62 ! Gly25 ! Ala28 ! Arg31
α 1 Val62 ! Gly25 ! Ala28 ! Cys104 ! Leu101 ! Asn97 ! Asp94
β 1 His92 ! Val98 ! Pro100 ! Arg104 ! Asn108 ! Cys112 ! Ala115
β 1 His 92 ! Val98 ! Pro100 ! Phe103 ! Leu106 ! Leu31 ! Val 33
30
Guang Hu
following execute files:
Cafrompdb.m: this is a function for reading a protein structure
from PDB file.
Graph.m: this is a function for transforming a protein structure
into a graph.
1. Start Matlab.
2. Copy cafrompdb.m and to Graph.m the work directory, and
use Cafrompdb.m and Graph.m to construct graphs from PDB
files, and type the flowing command lines in the Matlab
workspace.
$[G, A, C]=Graph(pdb_file, C, cutoff, pdb_path)
$ G = sparse (G);
G is a connected graph generated from the adjacent matrix (G),
in which each edge is weighted by commute time (C ij ).
3. Calculate shortest pathway using the Matlab built-in
functions.
$[dist, path, pred] = graphshortestpath(G, S, T)
For example, the pathway between Val62 in α1 chain to Asp94
α1 chain located at α 1 β 1 interface can be calculated as:
Input: [G,A,C]=Graph (‘2dn1.pdb’, ‘C_R.txt’, 7, ‘./’)
G=sparse(G);
[dist, path]=graphshortestpath (G, 62, 94)
Output: dist=5.6316e+03
path=62 25 28,104,101 97 94
Table 1 displays four examples of such pathways in R-Hb,
starting from Val62 in α 1 chain and His 92 in β 1 chain, to Arg31
and Asp94 in α 1 chain, and Ala115 and Val33 in β 1 chain located at
α 1 β 1 interface.
Table 1
Proposed paths of communication between ligand-binding and allosteric
sites within the monomer in R-Hbs
α 1 Val62 ! Gly25 ! Ala28 ! Arg31
α 1 Val62 ! Gly25 ! Ala28 ! Cys104 ! Leu101 ! Asn97 ! Asp94
β 1 His92 ! Val98 ! Pro100 ! Arg104 ! Asn108 ! Cys112 ! Ala115
β 1 His 92 ! Val98 ! Pro100 ! Phe103 ! Leu106 ! Leu31 ! Val 33
30
Guang Hu