

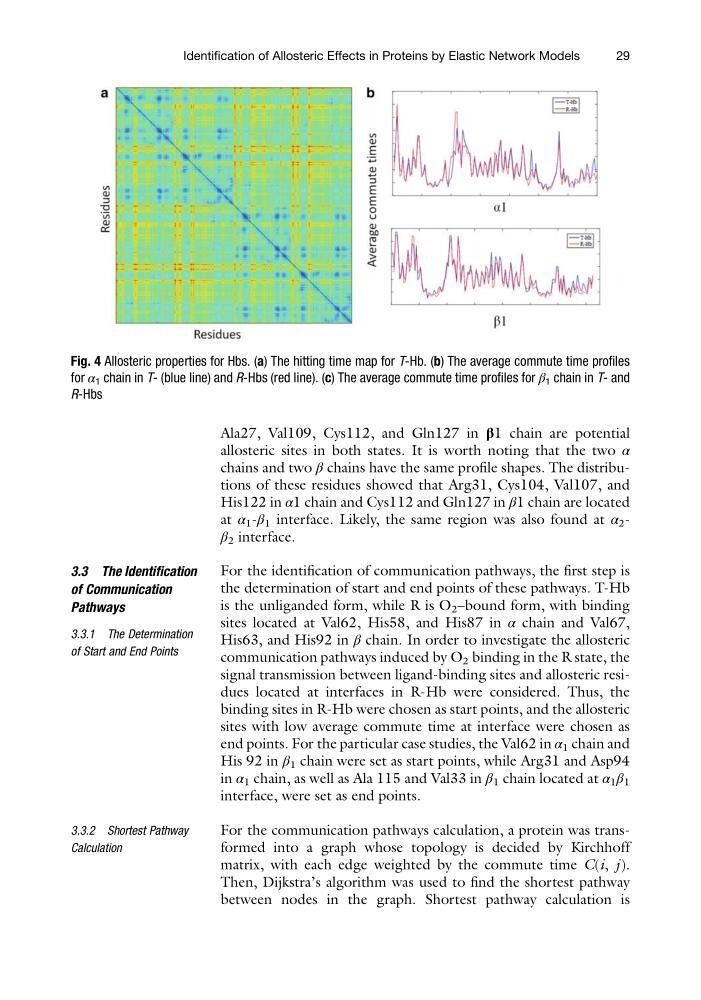
Ala27, Val109, Cys112, and Gln127 in β1 chain are potential
allosteric sites in both states. It is worth noting that the two α
chains and two β chains have the same profile shapes. The distributions of these residues showed that Arg31, Cys104, Val107, and
His122 in α1 chain and Cys112 and Gln127 in β1 chain are located
at α 1 -β 1 interface. Likely, the same region was also found at α 2 -
β 2 interface.
3.3 The Identification
of Communication
Pathways
3.3.1 The Determination
of Start and End Points
For the identification of communication pathways, the first step is
the determination of start and end points of these pathways. T-Hb
is the unliganded form, while R is O 2 –bound form, with binding
sites located at Val62, His58, and His87 in α chain and Val67,
His63, and His92 in β chain. In order to investigate the allosteric
communication pathways induced by O 2 binding in the R state, the
signal transmission between ligand-binding sites and allosteric residues located at interfaces in R-Hb were considered. Thus, the
binding sites in R-Hb were chosen as start points, and the allosteric
sites with low average commute time at interface were chosen as
end points. For the particular case studies, the Val62 in α 1 chain and
His 92 in β 1 chain were set as start points, while Arg31 and Asp94
in α 1 chain, as well as Ala 115 and Val33 in β 1 chain located at α 1 β 1
interface, were set as end points.
3.3.2 Shortest Pathway
Calculation
For the communication pathways calculation, a protein was transformed into a graph whose topology is decided by Kirchhoff
matrix, with each edge weighted by the commute time C(i, j).
Then, Dijkstra’s algorithm was used to find the shortest pathway
between nodes in the graph. Shortest pathway calculation is
Fig. 4 Allosteric properties for Hbs. (a) The hitting time map for T-Hb. (b) The average commute time profiles
for α 1 chain in T- (blue line) and R-Hbs (red line). (c) The average commute time profiles for β 1 chain in T- and
R-Hbs
Identification of Allosteric Effects in Proteins by Elastic Network Models
29
allosteric sites in both states. It is worth noting that the two α
chains and two β chains have the same profile shapes. The distributions of these residues showed that Arg31, Cys104, Val107, and
His122 in α1 chain and Cys112 and Gln127 in β1 chain are located
at α 1 -β 1 interface. Likely, the same region was also found at α 2 -
β 2 interface.
3.3 The Identification
of Communication
Pathways
3.3.1 The Determination
of Start and End Points
For the identification of communication pathways, the first step is
the determination of start and end points of these pathways. T-Hb
is the unliganded form, while R is O 2 –bound form, with binding
sites located at Val62, His58, and His87 in α chain and Val67,
His63, and His92 in β chain. In order to investigate the allosteric
communication pathways induced by O 2 binding in the R state, the
signal transmission between ligand-binding sites and allosteric residues located at interfaces in R-Hb were considered. Thus, the
binding sites in R-Hb were chosen as start points, and the allosteric
sites with low average commute time at interface were chosen as
end points. For the particular case studies, the Val62 in α 1 chain and
His 92 in β 1 chain were set as start points, while Arg31 and Asp94
in α 1 chain, as well as Ala 115 and Val33 in β 1 chain located at α 1 β 1
interface, were set as end points.
3.3.2 Shortest Pathway
Calculation
For the communication pathways calculation, a protein was transformed into a graph whose topology is decided by Kirchhoff
matrix, with each edge weighted by the commute time C(i, j).
Then, Dijkstra’s algorithm was used to find the shortest pathway
between nodes in the graph. Shortest pathway calculation is
Fig. 4 Allosteric properties for Hbs. (a) The hitting time map for T-Hb. (b) The average commute time profiles
for α 1 chain in T- (blue line) and R-Hbs (red line). (c) The average commute time profiles for β 1 chain in T- and
R-Hbs
Identification of Allosteric Effects in Proteins by Elastic Network Models
29