

2. Saving the ANM model for visualization in VMD and
NMWiz:
$writeNMD (‘ANM_T.nmd’, anm_T, T-Hb)
$writeNMD (‘ANM_R.nmd’, anm_R, R-Hb)
3. Calculation of the subspace overlap between the first 5 ANM
modes of T- and R-Hbs.
$calcOverlap (anm_T [:5], anm_R [:5]
$showOverlapTable (anm_T[:5], anm_R[:5])
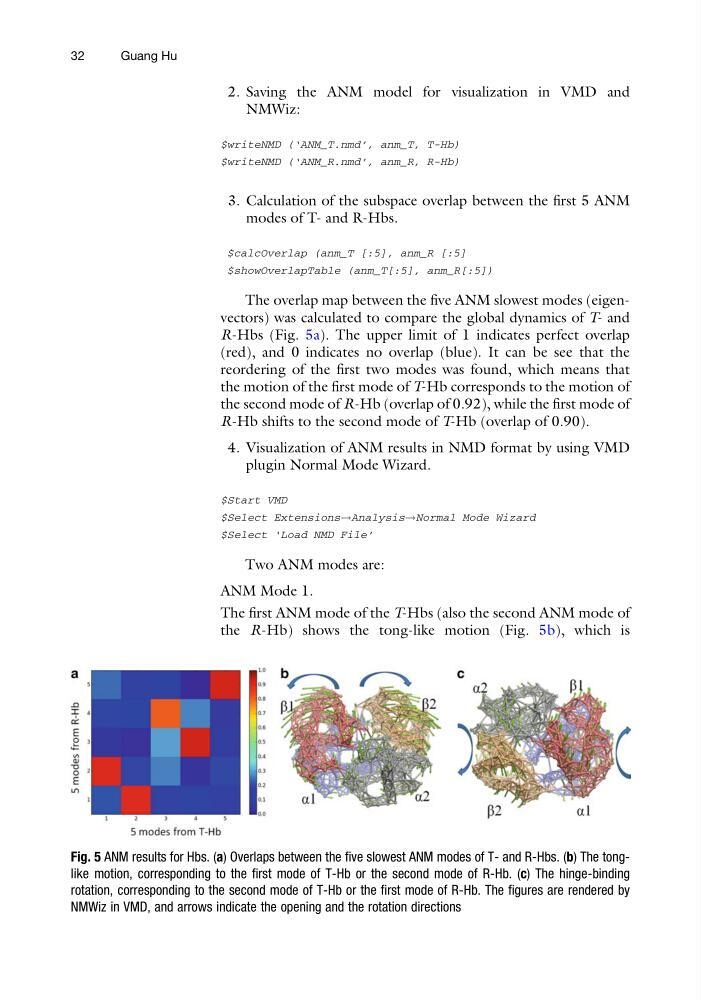
The overlap map between the five ANM slowest modes (eigenvectors) was calculated to compare the global dynamics of T- and
R-Hbs (Fig. 5a). The upper limit of 1 indicates perfect overlap
(red), and 0 indicates no overlap (blue). It can be see that the
reordering of the first two modes was found, which means that
the motion of the first mode of T-Hb corresponds to the motion of
the second mode of R-Hb (overlap of 0.92), while the first mode of
R-Hb shifts to the second mode of T-Hb (overlap of 0.90).
4. Visualization of ANM results in NMD format by using VMD
plugin Normal Mode Wizard.
$Start VMD
$Select Extensions!Analysis!Normal Mode Wizard
$Select ‘Load NMD File’
Two ANM modes are:
ANM Mode 1.
The first ANM mode of the T-Hbs (also the second ANM mode of
the R-Hb) shows the tong-like motion (Fig. 5b), which is
Fig. 5 ANM results for Hbs. (a) Overlaps between the five slowest ANM modes of T- and R-Hbs. (b) The tonglike motion, corresponding to the first mode of T-Hb or the second mode of R-Hb. (c) The hinge-binding
rotation, corresponding to the second mode of T-Hb or the first mode of R-Hb. The figures are rendered by
NMWiz in VMD, and arrows indicate the opening and the rotation directions
32
Guang Hu
NMWiz:
$writeNMD (‘ANM_T.nmd’, anm_T, T-Hb)
$writeNMD (‘ANM_R.nmd’, anm_R, R-Hb)
3. Calculation of the subspace overlap between the first 5 ANM
modes of T- and R-Hbs.
$calcOverlap (anm_T [:5], anm_R [:5]
$showOverlapTable (anm_T[:5], anm_R[:5])
The overlap map between the five ANM slowest modes (eigenvectors) was calculated to compare the global dynamics of T- and
R-Hbs (Fig. 5a). The upper limit of 1 indicates perfect overlap
(red), and 0 indicates no overlap (blue). It can be see that the
reordering of the first two modes was found, which means that
the motion of the first mode of T-Hb corresponds to the motion of
the second mode of R-Hb (overlap of 0.92), while the first mode of
R-Hb shifts to the second mode of T-Hb (overlap of 0.90).
4. Visualization of ANM results in NMD format by using VMD
plugin Normal Mode Wizard.
$Start VMD
$Select Extensions!Analysis!Normal Mode Wizard
$Select ‘Load NMD File’
Two ANM modes are:
ANM Mode 1.
The first ANM mode of the T-Hbs (also the second ANM mode of
the R-Hb) shows the tong-like motion (Fig. 5b), which is
Fig. 5 ANM results for Hbs. (a) Overlaps between the five slowest ANM modes of T- and R-Hbs. (b) The tonglike motion, corresponding to the first mode of T-Hb or the second mode of R-Hb. (c) The hinge-binding
rotation, corresponding to the second mode of T-Hb or the first mode of R-Hb. The figures are rendered by
NMWiz in VMD, and arrows indicate the opening and the rotation directions
32
Guang Hu