

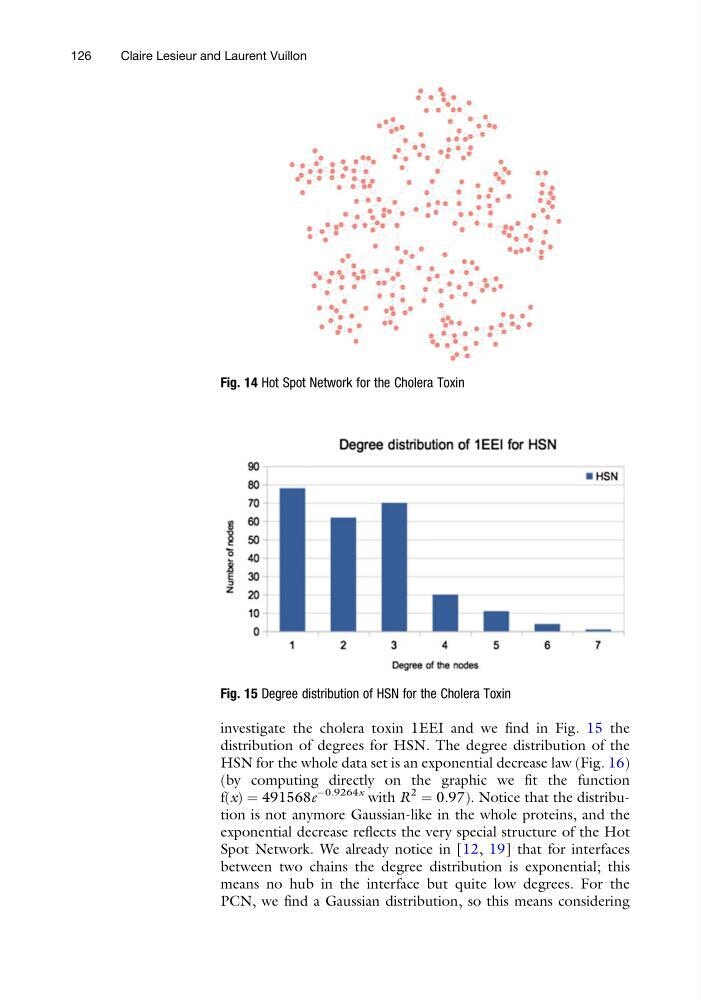
investigate the cholera toxin 1EEI and we find in Fig. 15 the
distribution of degrees for HSN. The degree distribution of the
HSN for the whole data set is an exponential decrease law (Fig. 16)
(by computing directly on the graphic we fit the function
f(x) ¼ 491568e
À0.9264x with R
2
¼ 0.97). Notice that the distribution is not anymore Gaussian-like in the whole proteins, and the
exponential decrease reflects the very special structure of the Hot
Spot Network. We already notice in [12, 19] that for interfaces
between two chains the degree distribution is exponential; this
means no hub in the interface but quite low degrees. For the
PCN, we find a Gaussian distribution, so this means considering
Fig. 14 Hot Spot Network for the Cholera Toxin
Fig. 15 Degree distribution of HSN for the Cholera Toxin
126
Claire Lesieur and Laurent Vuillon
distribution of degrees for HSN. The degree distribution of the
HSN for the whole data set is an exponential decrease law (Fig. 16)
(by computing directly on the graphic we fit the function
f(x) ¼ 491568e
À0.9264x with R
2
¼ 0.97). Notice that the distribution is not anymore Gaussian-like in the whole proteins, and the
exponential decrease reflects the very special structure of the Hot
Spot Network. We already notice in [12, 19] that for interfaces
between two chains the degree distribution is exponential; this
means no hub in the interface but quite low degrees. For the
PCN, we find a Gaussian distribution, so this means considering
Fig. 14 Hot Spot Network for the Cholera Toxin
Fig. 15 Degree distribution of HSN for the Cholera Toxin
126
Claire Lesieur and Laurent Vuillon