

with the G-protein. Clusters are seen to be spread over extracellular
regions encompassing residues of ECL2 and ECL1 regions (cyan
color). These clusters can also be seen to propagate to the intracellular region, hence establishing a possible link between these areas.
In the case of β 2 -anta (Fig. 5, panel b), the limited mobility of the
helices because of antagonist binding leads to a more compact and
discrete intracellular region. Hence the lateral clustering becomes
more dominant and discrete clusters can be observed in intracellular region.
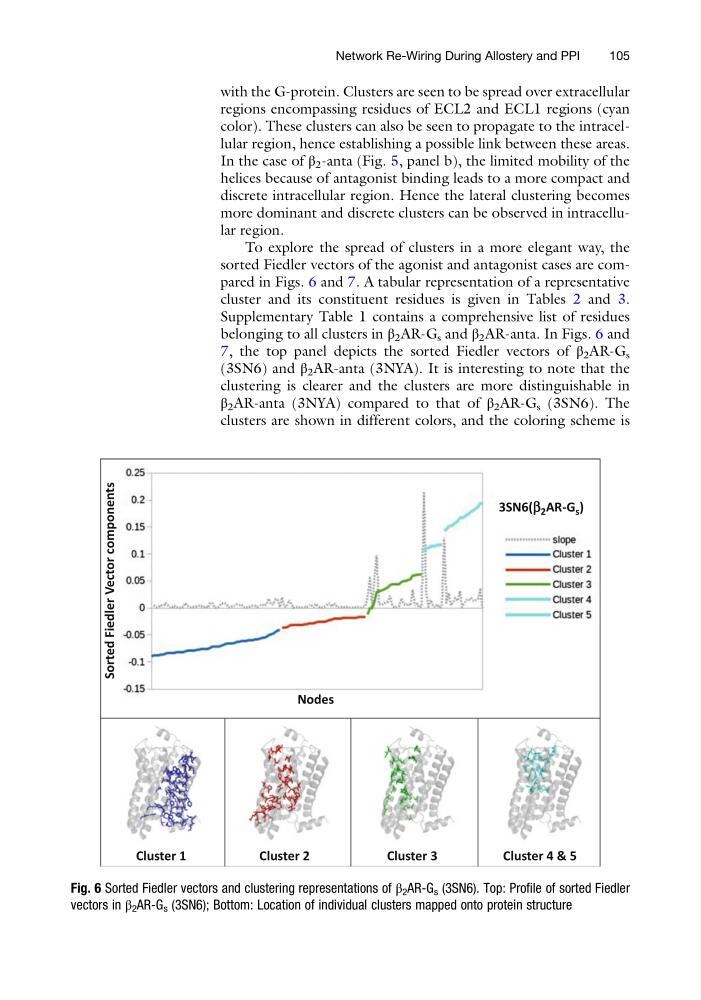
To explore the spread of clusters in a more elegant way, the
sorted Fiedler vectors of the agonist and antagonist cases are compared in Figs. 6 and 7. A tabular representation of a representative
cluster and its constituent residues is given in Tables 2 and 3.
Supplementary Table 1 contains a comprehensive list of residues
belonging to all clusters in β 2 AR-G s and β 2 AR-anta. In Figs. 6 and
7, the top panel depicts the sorted Fiedler vectors of β 2 AR-G s
(3SN6) and β 2 AR-anta (3NYA). It is interesting to note that the
clustering is clearer and the clusters are more distinguishable in
β 2 AR-anta (3NYA) compared to that of β 2 AR-G s (3SN6). The
clusters are shown in different colors, and the coloring scheme is
Cluster 1
Cluster 2
Nodes
3SN6(b 2 AR-G s )
Sorted Fiedler Vector components
Cluster 3
Cluster 4 & 5
Fig. 6 Sorted Fiedler vectors and clustering representations of β 2 AR-G s (3SN6). Top: Profile of sorted Fiedler
vectors in β 2 AR-G s (3SN6); Bottom: Location of individual clusters mapped onto protein structure
Network Re-Wiring During Allostery and PPI
105
regions encompassing residues of ECL2 and ECL1 regions (cyan
color). These clusters can also be seen to propagate to the intracellular region, hence establishing a possible link between these areas.
In the case of β 2 -anta (Fig. 5, panel b), the limited mobility of the
helices because of antagonist binding leads to a more compact and
discrete intracellular region. Hence the lateral clustering becomes
more dominant and discrete clusters can be observed in intracellular region.
To explore the spread of clusters in a more elegant way, the
sorted Fiedler vectors of the agonist and antagonist cases are compared in Figs. 6 and 7. A tabular representation of a representative
cluster and its constituent residues is given in Tables 2 and 3.
Supplementary Table 1 contains a comprehensive list of residues
belonging to all clusters in β 2 AR-G s and β 2 AR-anta. In Figs. 6 and
7, the top panel depicts the sorted Fiedler vectors of β 2 AR-G s
(3SN6) and β 2 AR-anta (3NYA). It is interesting to note that the
clustering is clearer and the clusters are more distinguishable in
β 2 AR-anta (3NYA) compared to that of β 2 AR-G s (3SN6). The
clusters are shown in different colors, and the coloring scheme is
Cluster 1
Cluster 2
Nodes
3SN6(b 2 AR-G s )
Sorted Fiedler Vector components
Cluster 3
Cluster 4 & 5
Fig. 6 Sorted Fiedler vectors and clustering representations of β 2 AR-G s (3SN6). Top: Profile of sorted Fiedler
vectors in β 2 AR-G s (3SN6); Bottom: Location of individual clusters mapped onto protein structure
Network Re-Wiring During Allostery and PPI
105