

the receptor rather than entering into stabilizing interactions with
the G-protein.
Another striking feature observed is weakening of interaction
between Ser203
5.42 and Ser207
5.46 . This interaction suffers a loss
in its edge weight (0.75 in β 2 AR-anta and 0.25 in β 2 AR-G s ). Due to
this weakening, the Pro211
5.50 is unable to get inward into the TM
core and as a resulting cascade of interactions; it leads to the
immobility of TM6. Also interesting is that this inability of
Pro211
5.50 to move inward may be owing to strong stacking interactions with Trp122
3.41 signified by a high edge weight (0.69 in
β 2 AR-anta and 0.07 in β 2 AR-G s ).
5.3 Spectral
Decomposition-based
Side-Chain Clustering
Patterns
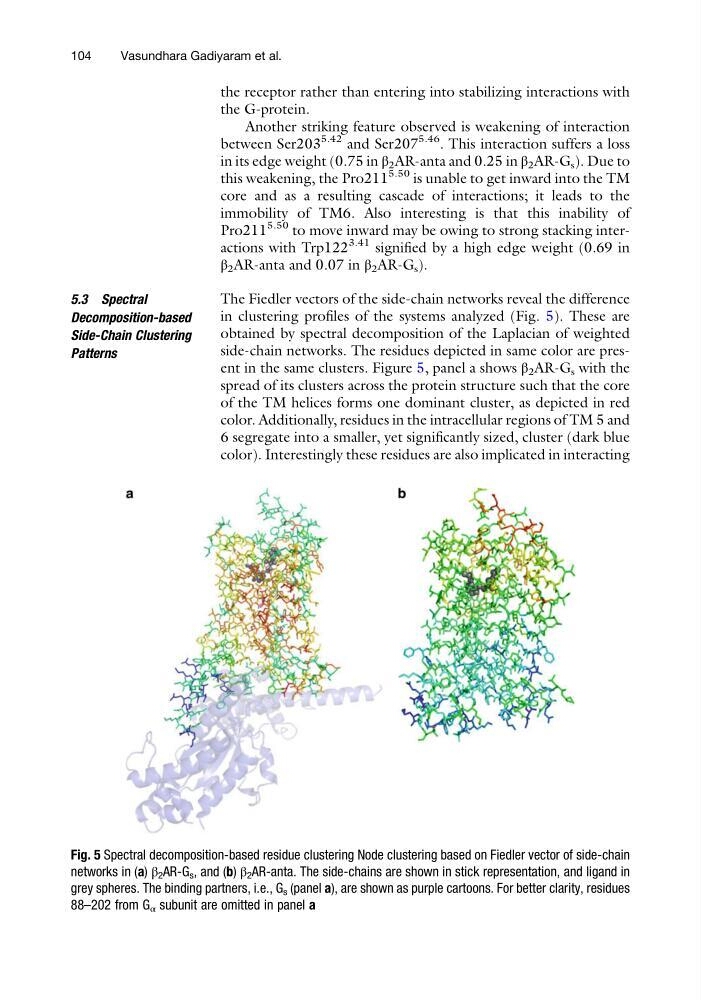
The Fiedler vectors of the side-chain networks reveal the difference
in clustering profiles of the systems analyzed (Fig. 5). These are
obtained by spectral decomposition of the Laplacian of weighted
side-chain networks. The residues depicted in same color are present in the same clusters. Figure 5, panel a shows β 2 AR-G s with the
spread of its clusters across the protein structure such that the core
of the TM helices forms one dominant cluster, as depicted in red
color. Additionally, residues in the intracellular regions of TM 5 and
6 segregate into a smaller, yet significantly sized, cluster (dark blue
color). Interestingly these residues are also implicated in interacting
Fig. 5 Spectral decomposition-based residue clustering Node clustering based on Fiedler vector of side-chain
networks in (a) β 2 AR-G s , and (b) β 2 AR-anta. The side-chains are shown in stick representation, and ligand in
grey spheres. The binding partners, i.e., G s (panel a), are shown as purple cartoons. For better clarity, residues
88–202 from G α subunit are omitted in panel a
104
Vasundhara Gadiyaram et al.
the G-protein.
Another striking feature observed is weakening of interaction
between Ser203
5.42 and Ser207
5.46 . This interaction suffers a loss
in its edge weight (0.75 in β 2 AR-anta and 0.25 in β 2 AR-G s ). Due to
this weakening, the Pro211
5.50 is unable to get inward into the TM
core and as a resulting cascade of interactions; it leads to the
immobility of TM6. Also interesting is that this inability of
Pro211
5.50 to move inward may be owing to strong stacking interactions with Trp122
3.41 signified by a high edge weight (0.69 in
β 2 AR-anta and 0.07 in β 2 AR-G s ).
5.3 Spectral
Decomposition-based
Side-Chain Clustering
Patterns
The Fiedler vectors of the side-chain networks reveal the difference
in clustering profiles of the systems analyzed (Fig. 5). These are
obtained by spectral decomposition of the Laplacian of weighted
side-chain networks. The residues depicted in same color are present in the same clusters. Figure 5, panel a shows β 2 AR-G s with the
spread of its clusters across the protein structure such that the core
of the TM helices forms one dominant cluster, as depicted in red
color. Additionally, residues in the intracellular regions of TM 5 and
6 segregate into a smaller, yet significantly sized, cluster (dark blue
color). Interestingly these residues are also implicated in interacting
Fig. 5 Spectral decomposition-based residue clustering Node clustering based on Fiedler vector of side-chain
networks in (a) β 2 AR-G s , and (b) β 2 AR-anta. The side-chains are shown in stick representation, and ligand in
grey spheres. The binding partners, i.e., G s (panel a), are shown as purple cartoons. For better clarity, residues
88–202 from G α subunit are omitted in panel a
104
Vasundhara Gadiyaram et al.