

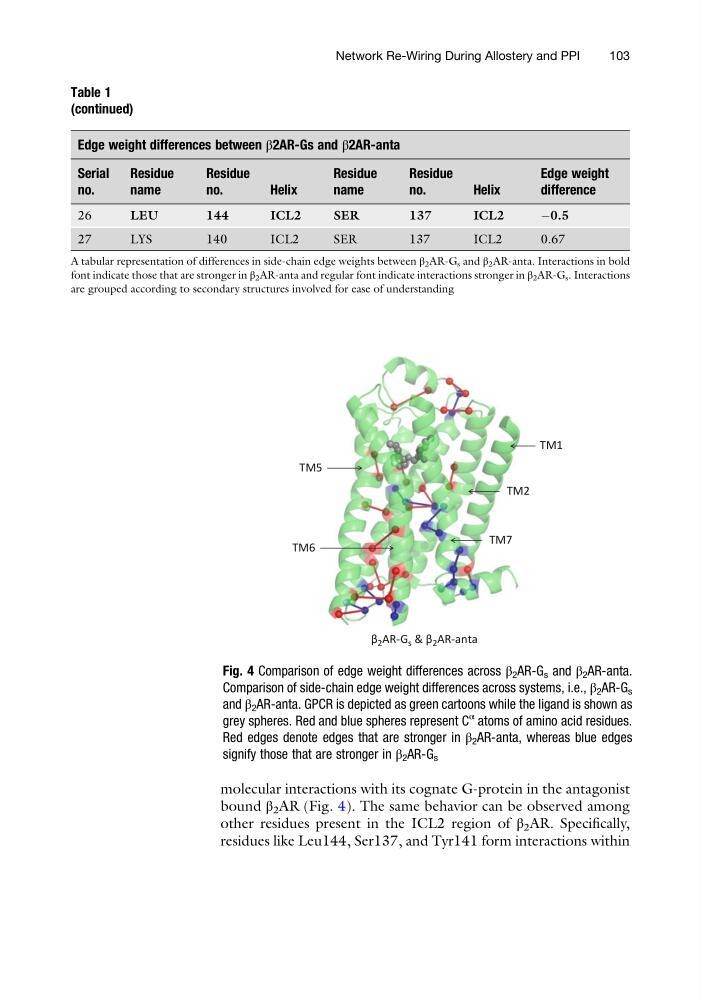
molecular interactions with its cognate G-protein in the antagonist
bound β 2 AR (Fig. 4). The same behavior can be observed among
other residues present in the ICL2 region of β 2 AR. Specifically,
residues like Leu144, Ser137, and Tyr141 form interactions within
Table 1
(continued)
Edge weight differences between β2AR-Gs and β2AR-anta
Serial
no.
Residue
name
Residue
no.
Helix
Residue
name
Residue
no.
Helix
Edge weight
difference
26
LEU
144
ICL2
SER
137
ICL2
À0.5
27
LYS
140
ICL2
SER
137
ICL2
0.67
A tabular representation of differences in side-chain edge weights between β 2 AR-G s and β 2 AR-anta. Interactions in bold
font indicate those that are stronger in β 2 AR-anta and regular font indicate interactions stronger in β 2 AR-G s . Interactions
are grouped according to secondary structures involved for ease of understanding
β 2 AR-G s & β 2 AR-anta
TM1
TM2
TM7
TM5
TM6
Fig. 4 Comparison of edge weight differences across β 2 AR-G s and β 2 AR-anta.
Comparison of side-chain edge weight differences across systems, i.e., β 2 AR-G s
and β 2 AR-anta. GPCR is depicted as green cartoons while the ligand is shown as
grey spheres. Red and blue spheres represent C
α
atoms of amino acid residues.
Red edges denote edges that are stronger in β 2 AR-anta, whereas blue edges
signify those that are stronger in β 2 AR-G s
Network Re-Wiring During Allostery and PPI
103
bound β 2 AR (Fig. 4). The same behavior can be observed among
other residues present in the ICL2 region of β 2 AR. Specifically,
residues like Leu144, Ser137, and Tyr141 form interactions within
Table 1
(continued)
Edge weight differences between β2AR-Gs and β2AR-anta
Serial
no.
Residue
name
Residue
no.
Helix
Residue
name
Residue
no.
Helix
Edge weight
difference
26
LEU
144
ICL2
SER
137
ICL2
À0.5
27
LYS
140
ICL2
SER
137
ICL2
0.67
A tabular representation of differences in side-chain edge weights between β 2 AR-G s and β 2 AR-anta. Interactions in bold
font indicate those that are stronger in β 2 AR-anta and regular font indicate interactions stronger in β 2 AR-G s . Interactions
are grouped according to secondary structures involved for ease of understanding
β 2 AR-G s & β 2 AR-anta
TM1
TM2
TM7
TM5
TM6
Fig. 4 Comparison of edge weight differences across β 2 AR-G s and β 2 AR-anta.
Comparison of side-chain edge weight differences across systems, i.e., β 2 AR-G s
and β 2 AR-anta. GPCR is depicted as green cartoons while the ligand is shown as
grey spheres. Red and blue spheres represent C
α
atoms of amino acid residues.
Red edges denote edges that are stronger in β 2 AR-anta, whereas blue edges
signify those that are stronger in β 2 AR-G s
Network Re-Wiring During Allostery and PPI
103