

25
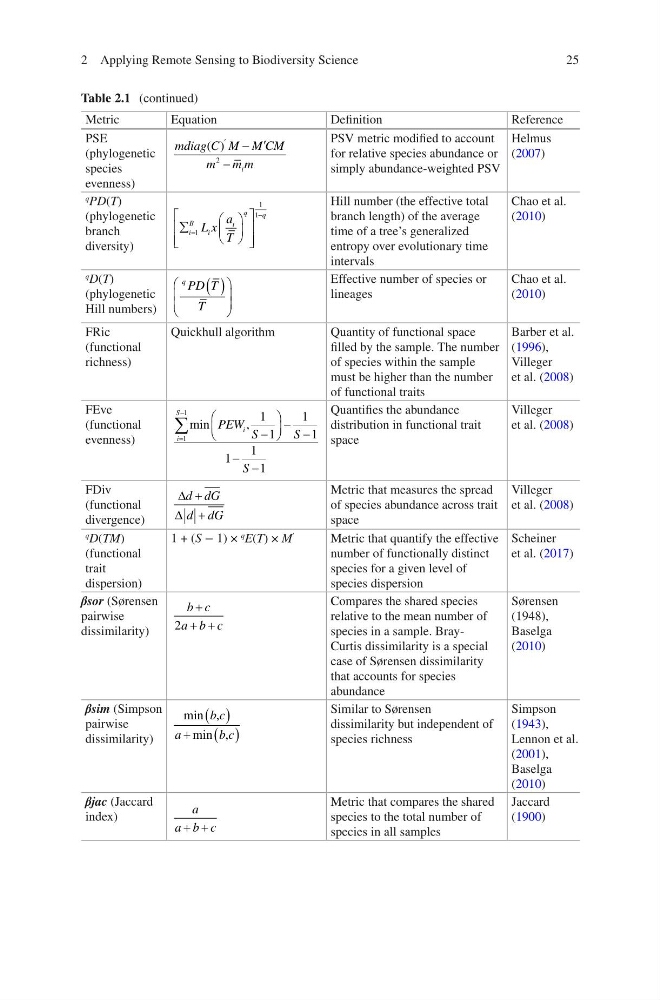
Table 2.1 (continued)
Metric
Equation
Definition
Reference
PSE
(phylogenetic
species
evenness)
mdiag C M MCM
m mm i
( )
c
c
2
PSV metric modified to account
for relative species abundance or
simply abundance-weighted PSV
Helmus
(2007)
q
PD(T)
(phylogenetic
branch
diversity)
¦
§
©
¨
·
¹
¸
ª
¬
«
«
º
¼
»
»
i
B
i
i
q
q
L x
a
T
1
1
1
Hill number (the effective total
branch length) of the average
time of a tree’s generalized
entropy over evolutionary time
intervals
Chao et al.
(2010)
q
D(T)
(phylogenetic
Hill numbers)
q PD T
T
§
©
¨
¨
·
¹
¸
¸
Effective number of species or
lineages
Chao et al.
(2010)
FRic
(functional
richness)
Quickhull algorithm
Quantity of functional space
filled by the sample. The number
of species within the sample
must be higher than the number
of functional traits
Barber et al.
(1996),
Villeger
et al. (2008)
FEve
(functional
evenness)
i
S
i
PEW S
S
S
¦
§
©
¨
·
¹
¸
1
1
1
1
1
1
1
1
1
min
,
Quantifies the abundance
distribution in functional trait
space
Villeger
et al. (2008)
FDiv
(functional
divergence)
'
'
d dG
d dG
Metric that measures the spread
of species abundance across trait
space
Villeger
et al. (2008)
q
D(TM)
(functional
trait
dispersion)
1 + (S − 1) ×
q E(T) × M
′
Metric that quantify the effective
number of functionally distinct
species for a given level of
species dispersion
Scheiner
et al. (2017)
βsor (Sørensen
pairwise
dissimilarity)
b c
a b c
+
+ +
2
Compares the shared species
relative to the mean number of
species in a sample. BrayCurtis dissimilarity is a special
case of Sørensen dissimilarity
that accounts for species
abundance
Sørensen
(1948),
Baselga
(2010)
βsim (Simpson
pairwise
dissimilarity)
min
min
b c
a
bc
,
,
Similar to Sørensen
dissimilarity but independent of
species richness
Simpson
(1943),
Lennon et al.
(2001),
Baselga
(2010)
βjac (Jaccard
index)
a
a b c
+ +
Metric that compares the shared
species to the total number of
species in all samples
Jaccard
(1900)
2 Applying Remote Sensing to Biodiversity Science
Table 2.1 (continued)
Metric
Equation
Definition
Reference
PSE
(phylogenetic
species
evenness)
mdiag C M MCM
m mm i
( )
c
c
2
PSV metric modified to account
for relative species abundance or
simply abundance-weighted PSV
Helmus
(2007)
q
PD(T)
(phylogenetic
branch
diversity)
¦
§
©
¨
·
¹
¸
ª
¬
«
«
º
¼
»
»
i
B
i
i
q
q
L x
a
T
1
1
1
Hill number (the effective total
branch length) of the average
time of a tree’s generalized
entropy over evolutionary time
intervals
Chao et al.
(2010)
q
D(T)
(phylogenetic
Hill numbers)
q PD T
T
§
©
¨
¨
·
¹
¸
¸
Effective number of species or
lineages
Chao et al.
(2010)
FRic
(functional
richness)
Quickhull algorithm
Quantity of functional space
filled by the sample. The number
of species within the sample
must be higher than the number
of functional traits
Barber et al.
(1996),
Villeger
et al. (2008)
FEve
(functional
evenness)
i
S
i
PEW S
S
S
¦
§
©
¨
·
¹
¸
1
1
1
1
1
1
1
1
1
min
,
Quantifies the abundance
distribution in functional trait
space
Villeger
et al. (2008)
FDiv
(functional
divergence)
'
'
d dG
d dG
Metric that measures the spread
of species abundance across trait
space
Villeger
et al. (2008)
q
D(TM)
(functional
trait
dispersion)
1 + (S − 1) ×
q E(T) × M
′
Metric that quantify the effective
number of functionally distinct
species for a given level of
species dispersion
Scheiner
et al. (2017)
βsor (Sørensen
pairwise
dissimilarity)
b c
a b c
+
+ +
2
Compares the shared species
relative to the mean number of
species in a sample. BrayCurtis dissimilarity is a special
case of Sørensen dissimilarity
that accounts for species
abundance
Sørensen
(1948),
Baselga
(2010)
βsim (Simpson
pairwise
dissimilarity)
min
min
b c
a
bc
,
,
Similar to Sørensen
dissimilarity but independent of
species richness
Simpson
(1943),
Lennon et al.
(2001),
Baselga
(2010)
βjac (Jaccard
index)
a
a b c
+ +
Metric that compares the shared
species to the total number of
species in all samples
Jaccard
(1900)
2 Applying Remote Sensing to Biodiversity Science