

21
conserved, but others related to species interactions or with the abiotic environment
vary considerably among close relatives, there is the potential to tease apart spectral
signals that may relate to species interactions.
Spatial patterns of spectral similarity and dissimilarity also have the potential to
provide meaningful information about ecological processes and the forces that
dominate community assembly at a particular scale. For example, to the extent that
spectral similarity of neighboring plants can be determined, high spectral similarity might indicate that functionally and/or phylogenetically similar individuals are
sorting into the same environment, while spectral dissimilarity might indicate that
quite distinct individuals are able to coexist if they exhibit complementarity by
Biogeographic processes:
speciation, extinction
Time
- - - - - Dispersal - - - - -
Density
dependent
interactions
1 cm
1 m
Environmental
filtering
30 m
Environmental sorting and
filtering
Evolutionary legacy
effects on
ecosystems
Biotic interactions and density
dependent effects
1 km
Space
A
B
C
D
E
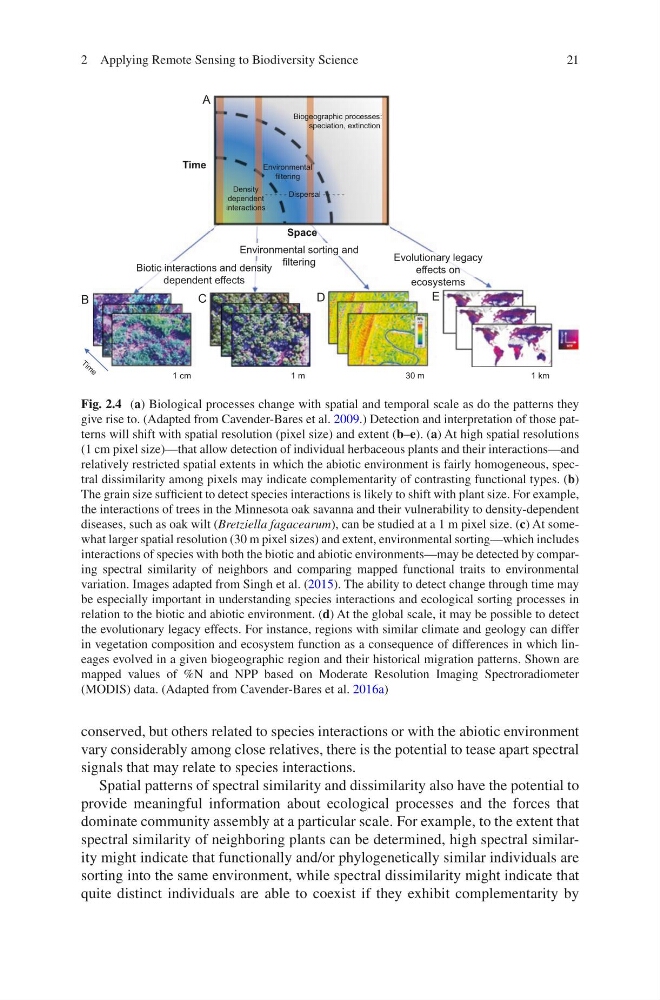
Fig. 2.4 (a) Biological processes change with spatial and temporal scale as do the patterns they
give rise to. (Adapted from Cavender-Bares et al. 2009.) Detection and interpretation of those patterns will shift with spatial resolution (pixel size) and extent (b–e). (a) At high spatial resolutions
(1 cm pixel size)—that allow detection of individual herbaceous plants and their interactions—and
relatively restricted spatial extents in which the abiotic environment is fairly homogeneous, spectral dissimilarity among pixels may indicate complementarity of contrasting functional types. (b)
The grain size sufficient to detect species interactions is likely to shift with plant size. For example,
the interactions of trees in the Minnesota oak savanna and their vulnerability to density-dependent
diseases, such as oak wilt (Bretziella fagacearum), can be studied at a 1 m pixel size. (c) At somewhat larger spatial resolution (30 m pixel sizes) and extent, environmental sorting—which includes
interactions of species with both the biotic and abiotic environments—may be detected by comparing spectral similarity of neighbors and comparing mapped functional traits to environmental
variation. Images adapted from Singh et al. (2015). The ability to detect change through time may
be especially important in understanding species interactions and ecological sorting processes in
relation to the biotic and abiotic environment. (d) At the global scale, it may be possible to detect
the evolutionary legacy effects. For instance, regions with similar climate and geology can differ
in vegetation composition and ecosystem function as a consequence of differences in which lineages evolved in a given biogeographic region and their historical migration patterns. Shown are
mapped values of %N and NPP based on Moderate Resolution Imaging Spectroradiometer
(MODIS) data. (Adapted from Cavender-Bares et al. 2016a)
2 Applying Remote Sensing to Biodiversity Science
conserved, but others related to species interactions or with the abiotic environment
vary considerably among close relatives, there is the potential to tease apart spectral
signals that may relate to species interactions.
Spatial patterns of spectral similarity and dissimilarity also have the potential to
provide meaningful information about ecological processes and the forces that
dominate community assembly at a particular scale. For example, to the extent that
spectral similarity of neighboring plants can be determined, high spectral similarity might indicate that functionally and/or phylogenetically similar individuals are
sorting into the same environment, while spectral dissimilarity might indicate that
quite distinct individuals are able to coexist if they exhibit complementarity by
Biogeographic processes:
speciation, extinction
Time
- - - - - Dispersal - - - - -
Density
dependent
interactions
1 cm
1 m
Environmental
filtering
30 m
Environmental sorting and
filtering
Evolutionary legacy
effects on
ecosystems
Biotic interactions and density
dependent effects
1 km
Space
A
B
C
D
E
Fig. 2.4 (a) Biological processes change with spatial and temporal scale as do the patterns they
give rise to. (Adapted from Cavender-Bares et al. 2009.) Detection and interpretation of those patterns will shift with spatial resolution (pixel size) and extent (b–e). (a) At high spatial resolutions
(1 cm pixel size)—that allow detection of individual herbaceous plants and their interactions—and
relatively restricted spatial extents in which the abiotic environment is fairly homogeneous, spectral dissimilarity among pixels may indicate complementarity of contrasting functional types. (b)
The grain size sufficient to detect species interactions is likely to shift with plant size. For example,
the interactions of trees in the Minnesota oak savanna and their vulnerability to density-dependent
diseases, such as oak wilt (Bretziella fagacearum), can be studied at a 1 m pixel size. (c) At somewhat larger spatial resolution (30 m pixel sizes) and extent, environmental sorting—which includes
interactions of species with both the biotic and abiotic environments—may be detected by comparing spectral similarity of neighbors and comparing mapped functional traits to environmental
variation. Images adapted from Singh et al. (2015). The ability to detect change through time may
be especially important in understanding species interactions and ecological sorting processes in
relation to the biotic and abiotic environment. (d) At the global scale, it may be possible to detect
the evolutionary legacy effects. For instance, regions with similar climate and geology can differ
in vegetation composition and ecosystem function as a consequence of differences in which lineages evolved in a given biogeographic region and their historical migration patterns. Shown are
mapped values of %N and NPP based on Moderate Resolution Imaging Spectroradiometer
(MODIS) data. (Adapted from Cavender-Bares et al. 2016a)
2 Applying Remote Sensing to Biodiversity Science