

376
(Curran 1989) and nearly impossible to untangle their spectral properties in intact
leaves, at least with the spectral resolution and models available today. However, the
variability in these properties makes it possible to use various regression, classification, and self-learning techniques to identify genera or species without knowing
exactly the biochemical composition that identifies them. Features in the NIR and
SWIR are relatively weak and spectrally broad, having originated as harmonics
(integer multiples of the fundamental frequency) and overtones (frequencies higher
than the fundamental frequency) from wavelengths in the UV and middle-infrared
ranges (2500–6000 nm).
While the absorption spectra are not identical, cellulose, starch, and sugar have
strong similarities due to their hydrocarbon chain chemical structures. The
PROSPECT models continue to consider these compounds together as “dry matter
content,” given the uncertainty in their absorption coefficients. Retrieval of dry matter in the models permits estimation of dry biomass; when expressed on a leaf area
basis, this yields leaf mass area (dry biomass/leaf area), a measure shown to be
highly correlated with photosynthetic production (Poorter et al. 2009). The presence
or absence of various lignins, humic acids, and aromatic polyphenols can be determined from absorptions at 1420 and 1920 nm that are related to O–H bonds and
C=O vibrations, with shoulders at 1700 and 2100 nm that are related to aromatic
C–H bonds (Ziechmann 1964). Kokaly and Skidmore (2015) recently reported a
narrow feature for aromatic C–H bonds in phenolic compounds of various woody
species and non-hydroxylated aromatics at 1660 nm. Phenolic compounds are generally considered important in plant defense.
Curran (1989) noted that absorption features in leaves are broadened by multiple
scattering and often interfere with one another. He cites an example where the first
overtones of the N-H and O-H stretch overlap for most of their width. Thus, most
studies have opted to analyze spectral data and relationships by identifying taxa or
identifying leaf traits using various statistical methods such as multiple stepwise
regression (e.g., Serrano et al. 2002), partial least squares regression (PLSR; e.g.,
Smith et al. 2002; Ollinger et al. 2008), discriminant function analysis (Filella et al.
1994), continuum removal (Kokaly and Clark 1999; Kokaly 2001), wavelets (Cheng
et al. 2011, 2012, 2014; Kalacska et al. 2015), or a combination of PLSR, nested
D-Glucose
D-Xylose
L-Arabinose
D-Mannose
D-Galactose
OH
OH
OH
OH
OH
OH
O
OH
O
OH
OH
OH
O
HO
HO
HO
HO
HO
HO
OH
OH
OH
OH
O
OH
O
HO
HO
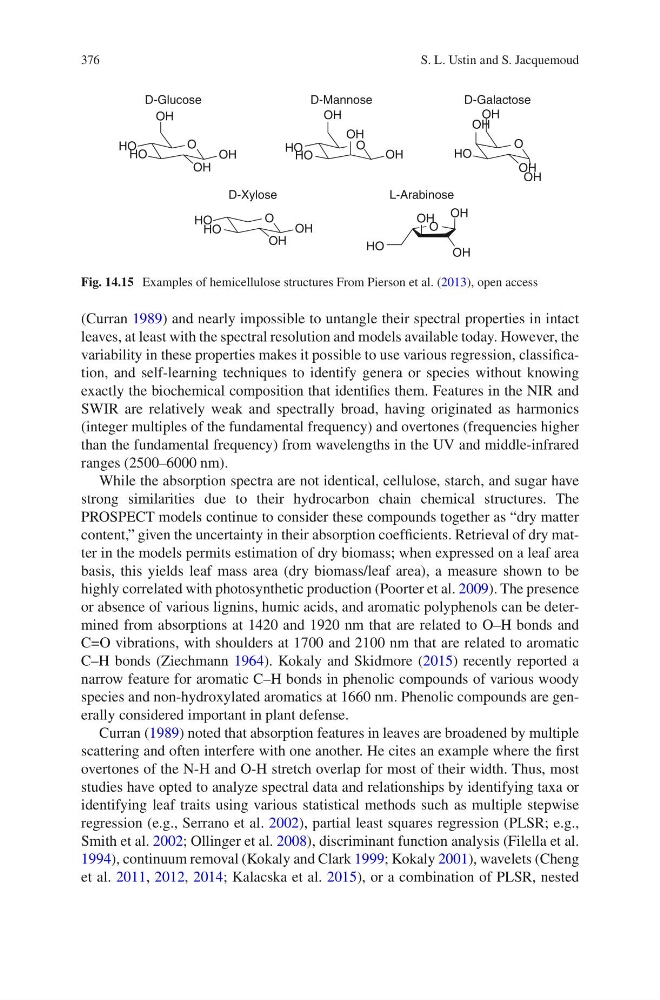
Fig. 14.15 Examples of hemicellulose structures From Pierson et al. (2013), open access
S. L. Ustin and S. Jacquemoud
(Curran 1989) and nearly impossible to untangle their spectral properties in intact
leaves, at least with the spectral resolution and models available today. However, the
variability in these properties makes it possible to use various regression, classification, and self-learning techniques to identify genera or species without knowing
exactly the biochemical composition that identifies them. Features in the NIR and
SWIR are relatively weak and spectrally broad, having originated as harmonics
(integer multiples of the fundamental frequency) and overtones (frequencies higher
than the fundamental frequency) from wavelengths in the UV and middle-infrared
ranges (2500–6000 nm).
While the absorption spectra are not identical, cellulose, starch, and sugar have
strong similarities due to their hydrocarbon chain chemical structures. The
PROSPECT models continue to consider these compounds together as “dry matter
content,” given the uncertainty in their absorption coefficients. Retrieval of dry matter in the models permits estimation of dry biomass; when expressed on a leaf area
basis, this yields leaf mass area (dry biomass/leaf area), a measure shown to be
highly correlated with photosynthetic production (Poorter et al. 2009). The presence
or absence of various lignins, humic acids, and aromatic polyphenols can be determined from absorptions at 1420 and 1920 nm that are related to O–H bonds and
C=O vibrations, with shoulders at 1700 and 2100 nm that are related to aromatic
C–H bonds (Ziechmann 1964). Kokaly and Skidmore (2015) recently reported a
narrow feature for aromatic C–H bonds in phenolic compounds of various woody
species and non-hydroxylated aromatics at 1660 nm. Phenolic compounds are generally considered important in plant defense.
Curran (1989) noted that absorption features in leaves are broadened by multiple
scattering and often interfere with one another. He cites an example where the first
overtones of the N-H and O-H stretch overlap for most of their width. Thus, most
studies have opted to analyze spectral data and relationships by identifying taxa or
identifying leaf traits using various statistical methods such as multiple stepwise
regression (e.g., Serrano et al. 2002), partial least squares regression (PLSR; e.g.,
Smith et al. 2002; Ollinger et al. 2008), discriminant function analysis (Filella et al.
1994), continuum removal (Kokaly and Clark 1999; Kokaly 2001), wavelets (Cheng
et al. 2011, 2012, 2014; Kalacska et al. 2015), or a combination of PLSR, nested
D-Glucose
D-Xylose
L-Arabinose
D-Mannose
D-Galactose
OH
OH
OH
OH
OH
OH
O
OH
O
OH
OH
OH
O
HO
HO
HO
HO
HO
HO
OH
OH
OH
OH
O
OH
O
HO
HO
Fig. 14.15 Examples of hemicellulose structures From Pierson et al. (2013), open access
S. L. Ustin and S. Jacquemoud