

260
implement a multiple spatial regression in which the covariance among residuals
considers the neighborhood of each evaluated cell (Rangel et al. 2006). To evaluate
model fit, we computed pseudo-R
2
for our models, including both the full model and
the predictor-only effect (i.e., removing the effect of space and spatial autocorrelation). Also, to detect areas of potential concentration or overdispersion of the regression residuals, we generated residual maps for models of SR and PD.
11.4 Results and Discussion
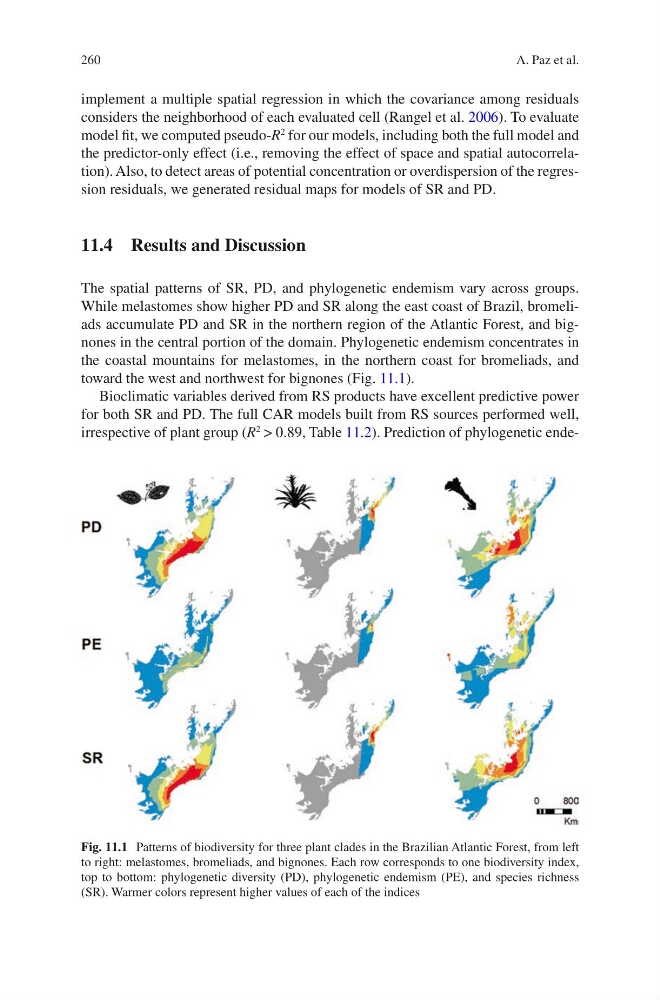
The spatial patterns of SR, PD, and phylogenetic endemism vary across groups.
While melastomes show higher PD and SR along the east coast of Brazil, bromeliads accumulate PD and SR in the northern region of the Atlantic Forest, and bignones in the central portion of the domain. Phylogenetic endemism concentrates in
the coastal mountains for melastomes, in the northern coast for bromeliads, and
toward the west and northwest for bignones (Fig. 11.1).
Bioclimatic variables derived from RS products have excellent predictive power
for both SR and PD. The full CAR models built from RS sources performed well,
irrespective of plant group (R
2
> 0.89, Table 11.2). Prediction of phylogenetic endeFig. 11.1 Patterns of biodiversity for three plant clades in the Brazilian Atlantic Forest, from left
to right: melastomes, bromeliads, and bignones. Each row corresponds to one biodiversity index,
top to bottom: phylogenetic diversity (PD), phylogenetic endemism (PE), and species richness
(SR). Warmer colors represent higher values of each of the indices
A. Paz et al.
implement a multiple spatial regression in which the covariance among residuals
considers the neighborhood of each evaluated cell (Rangel et al. 2006). To evaluate
model fit, we computed pseudo-R
2
for our models, including both the full model and
the predictor-only effect (i.e., removing the effect of space and spatial autocorrelation). Also, to detect areas of potential concentration or overdispersion of the regression residuals, we generated residual maps for models of SR and PD.
11.4 Results and Discussion
The spatial patterns of SR, PD, and phylogenetic endemism vary across groups.
While melastomes show higher PD and SR along the east coast of Brazil, bromeliads accumulate PD and SR in the northern region of the Atlantic Forest, and bignones in the central portion of the domain. Phylogenetic endemism concentrates in
the coastal mountains for melastomes, in the northern coast for bromeliads, and
toward the west and northwest for bignones (Fig. 11.1).
Bioclimatic variables derived from RS products have excellent predictive power
for both SR and PD. The full CAR models built from RS sources performed well,
irrespective of plant group (R
2
> 0.89, Table 11.2). Prediction of phylogenetic endeFig. 11.1 Patterns of biodiversity for three plant clades in the Brazilian Atlantic Forest, from left
to right: melastomes, bromeliads, and bignones. Each row corresponds to one biodiversity index,
top to bottom: phylogenetic diversity (PD), phylogenetic endemism (PE), and species richness
(SR). Warmer colors represent higher values of each of the indices
A. Paz et al.