

259
(PE, Rosauer et al. 2009). This metric takes into account the evolutionary history
(as branch lengths) and spatial restriction (here as range estimates; Rosauer et al.
2009). To allow for comparisons across plant groups with distinct life histories and
environmental envelopes, we performed these analyses separately for each clade
(melastomes, bromeliads, and bignones). We used the Biodiverse software (Laffan
et al. 2010) to map the geographical patterns of SR, the PD, and the phylogenetic
endemism of each group.
We then gathered climatic descriptors for the Atlantic Forest region using two
sources of climatic data, both at a 0.05° resolution (~5 km): one derived from RS
instruments (Deblauwe et al. 2016) and another derived from interpolated weather
station data (WorldClim database; Hijmans et al. 2005). Both databases describe
environmental variation in the form of 19 bioclimatic variables that reflect spatial
and temporal differences in precipitation and temperature (Bio1-19, as defined in
the WorldClim database). These data were estimated with the same formulae, across
data sets. While the WorldClim data reflect bioclimatic conditions estimated
from interpolated weather station information, the database of Deblauwe et al.
(2016) was built based on temperature information from NASA’s Moderate
Resolution Imaging Spectroradiometer (MODIS) and precipitation from the Climate
Hazards Group InfraRed Precipitation with Station (CHIRPS) data. To reduce collinearity between the 19 bioclimatic variables, we employed a variance inflation
factor (VIF), retaining only those variables with VIF < 5 in both datasets in all analyses. This left us with seven variables from each source, in both cases bio 3, 8, 9
13,18, and 19, plus bio 2 for the dataset based on weather station data (WorldClim),
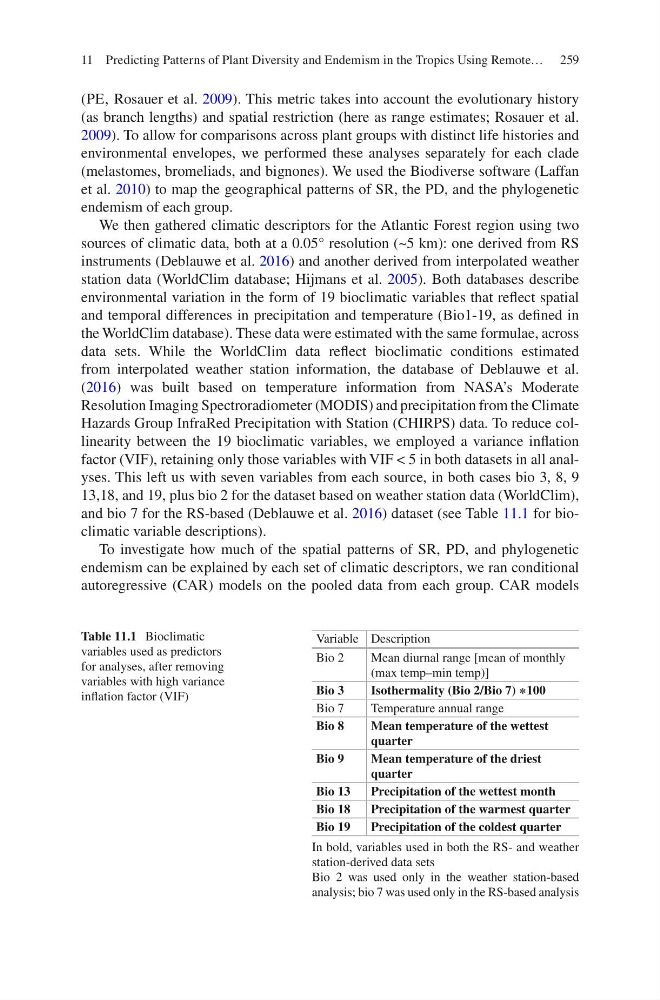
and bio 7 for the RS-based (Deblauwe et al. 2016) dataset (see Table 11.1 for bioclimatic variable descriptions).
To investigate how much of the spatial patterns of SR, PD, and phylogenetic
endemism can be explained by each set of climatic descriptors, we ran conditional
autoregressive (CAR) models on the pooled data from each group. CAR models
Table 11.1 Bioclimatic
variables used as predictors
for analyses, after removing
variables with high variance
inflation factor (VIF)
Variable Description
Bio 2
Mean diurnal range [mean of monthly
(max temp–min temp)]
Bio 3
Isothermality (Bio 2/Bio 7) ∗100
Bio 7
Temperature annual range
Bio 8
Mean temperature of the wettest
quarter
Bio 9
Mean temperature of the driest
quarter
Bio 13
Precipitation of the wettest month
Bio 18
Precipitation of the warmest quarter
Bio 19
Precipitation of the coldest quarter
In bold, variables used in both the RS- and weather
station-derived data sets
Bio 2 was used only in the weather station-based
analysis; bio 7 was used only in the RS-based analysis
11 Predicting Patterns of Plant Diversity and Endemism in the Tropics Using Remote…
(PE, Rosauer et al. 2009). This metric takes into account the evolutionary history
(as branch lengths) and spatial restriction (here as range estimates; Rosauer et al.
2009). To allow for comparisons across plant groups with distinct life histories and
environmental envelopes, we performed these analyses separately for each clade
(melastomes, bromeliads, and bignones). We used the Biodiverse software (Laffan
et al. 2010) to map the geographical patterns of SR, the PD, and the phylogenetic
endemism of each group.
We then gathered climatic descriptors for the Atlantic Forest region using two
sources of climatic data, both at a 0.05° resolution (~5 km): one derived from RS
instruments (Deblauwe et al. 2016) and another derived from interpolated weather
station data (WorldClim database; Hijmans et al. 2005). Both databases describe
environmental variation in the form of 19 bioclimatic variables that reflect spatial
and temporal differences in precipitation and temperature (Bio1-19, as defined in
the WorldClim database). These data were estimated with the same formulae, across
data sets. While the WorldClim data reflect bioclimatic conditions estimated
from interpolated weather station information, the database of Deblauwe et al.
(2016) was built based on temperature information from NASA’s Moderate
Resolution Imaging Spectroradiometer (MODIS) and precipitation from the Climate
Hazards Group InfraRed Precipitation with Station (CHIRPS) data. To reduce collinearity between the 19 bioclimatic variables, we employed a variance inflation
factor (VIF), retaining only those variables with VIF < 5 in both datasets in all analyses. This left us with seven variables from each source, in both cases bio 3, 8, 9
13,18, and 19, plus bio 2 for the dataset based on weather station data (WorldClim),
and bio 7 for the RS-based (Deblauwe et al. 2016) dataset (see Table 11.1 for bioclimatic variable descriptions).
To investigate how much of the spatial patterns of SR, PD, and phylogenetic
endemism can be explained by each set of climatic descriptors, we ran conditional
autoregressive (CAR) models on the pooled data from each group. CAR models
Table 11.1 Bioclimatic
variables used as predictors
for analyses, after removing
variables with high variance
inflation factor (VIF)
Variable Description
Bio 2
Mean diurnal range [mean of monthly
(max temp–min temp)]
Bio 3
Isothermality (Bio 2/Bio 7) ∗100
Bio 7
Temperature annual range
Bio 8
Mean temperature of the wettest
quarter
Bio 9
Mean temperature of the driest
quarter
Bio 13
Precipitation of the wettest month
Bio 18
Precipitation of the warmest quarter
Bio 19
Precipitation of the coldest quarter
In bold, variables used in both the RS- and weather
station-derived data sets
Bio 2 was used only in the weather station-based
analysis; bio 7 was used only in the RS-based analysis
11 Predicting Patterns of Plant Diversity and Endemism in the Tropics Using Remote…