

261
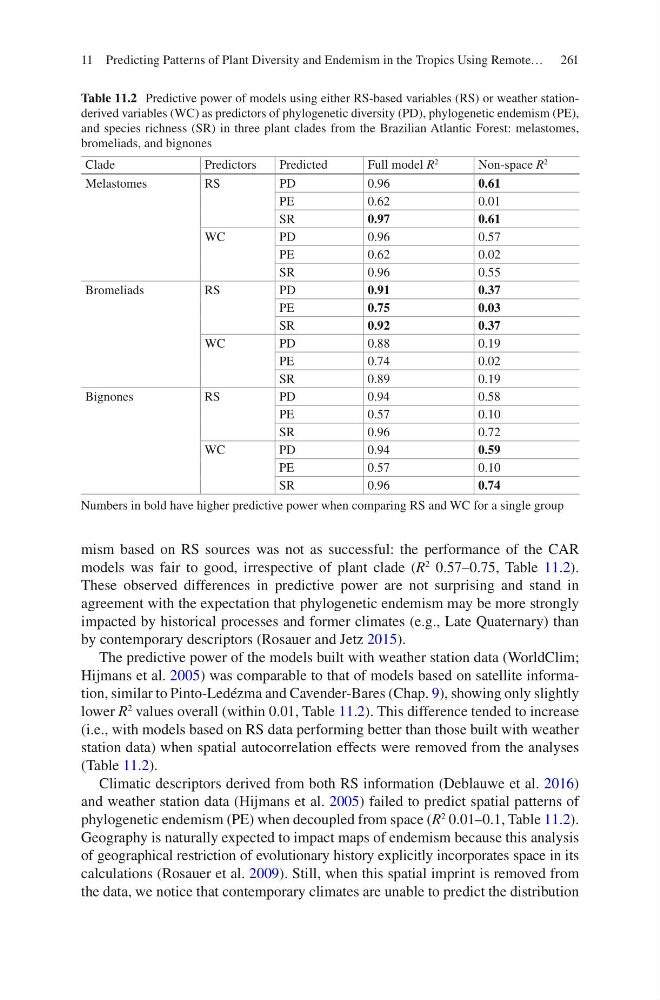
mism based on RS sources was not as successful: the performance of the CAR
models was fair to good, irrespective of plant clade (R
2
0.57–0.75, Table 11.2).
These observed differences in predictive power are not surprising and stand in
agreement with the expectation that phylogenetic endemism may be more strongly
impacted by historical processes and former climates (e.g., Late Quaternary) than
by contemporary descriptors (Rosauer and Jetz 2015).
The predictive power of the models built with weather station data (WorldClim;
Hijmans et al. 2005) was comparable to that of models based on satellite information, similar to Pinto-Ledézma and Cavender-Bares (Chap. 9), showing only slightly
lower R
2
values overall (within 0.01, Table 11.2). This difference tended to increase
(i.e., with models based on RS data performing better than those built with weather
station data) when spatial autocorrelation effects were removed from the analyses
(Table 11.2).
Climatic descriptors derived from both RS information (Deblauwe et al. 2016)
and weather station data (Hijmans et al. 2005) failed to predict spatial patterns of
phylogenetic endemism (PE) when decoupled from space (R
2
0.01–0.1, Table 11.2).
Geography is naturally expected to impact maps of endemism because this analysis
of geographical restriction of evolutionary history explicitly incorporates space in its
calculations (Rosauer et al. 2009). Still, when this spatial imprint is removed from
the data, we notice that contemporary climates are unable to predict the distribution
Table 11.2 Predictive power of models using either RS-based variables (RS) or weather stationderived variables (WC) as predictors of phylogenetic diversity (PD), phylogenetic endemism (PE),
and species richness (SR) in three plant clades from the Brazilian Atlantic Forest: melastomes,
bromeliads, and bignones
Clade
Predictors
Predicted
Full model R
2
Non-space R
2
Melastomes
RS
PD
0.96
0.61
PE
0.62
0.01
SR
0.97
0.61
WC
PD
0.96
0.57
PE
0.62
0.02
SR
0.96
0.55
Bromeliads
RS
PD
0.91
0.37
PE
0.75
0.03
SR
0.92
0.37
WC
PD
0.88
0.19
PE
0.74
0.02
SR
0.89
0.19
Bignones
RS
PD
0.94
0.58
PE
0.57
0.10
SR
0.96
0.72
WC
PD
0.94
0.59
PE
0.57
0.10
SR
0.96
0.74
Numbers in bold have higher predictive power when comparing RS and WC for a single group
11 Predicting Patterns of Plant Diversity and Endemism in the Tropics Using Remote…
mism based on RS sources was not as successful: the performance of the CAR
models was fair to good, irrespective of plant clade (R
2
0.57–0.75, Table 11.2).
These observed differences in predictive power are not surprising and stand in
agreement with the expectation that phylogenetic endemism may be more strongly
impacted by historical processes and former climates (e.g., Late Quaternary) than
by contemporary descriptors (Rosauer and Jetz 2015).
The predictive power of the models built with weather station data (WorldClim;
Hijmans et al. 2005) was comparable to that of models based on satellite information, similar to Pinto-Ledézma and Cavender-Bares (Chap. 9), showing only slightly
lower R
2
values overall (within 0.01, Table 11.2). This difference tended to increase
(i.e., with models based on RS data performing better than those built with weather
station data) when spatial autocorrelation effects were removed from the analyses
(Table 11.2).
Climatic descriptors derived from both RS information (Deblauwe et al. 2016)
and weather station data (Hijmans et al. 2005) failed to predict spatial patterns of
phylogenetic endemism (PE) when decoupled from space (R
2
0.01–0.1, Table 11.2).
Geography is naturally expected to impact maps of endemism because this analysis
of geographical restriction of evolutionary history explicitly incorporates space in its
calculations (Rosauer et al. 2009). Still, when this spatial imprint is removed from
the data, we notice that contemporary climates are unable to predict the distribution
Table 11.2 Predictive power of models using either RS-based variables (RS) or weather stationderived variables (WC) as predictors of phylogenetic diversity (PD), phylogenetic endemism (PE),
and species richness (SR) in three plant clades from the Brazilian Atlantic Forest: melastomes,
bromeliads, and bignones
Clade
Predictors
Predicted
Full model R
2
Non-space R
2
Melastomes
RS
PD
0.96
0.61
PE
0.62
0.01
SR
0.97
0.61
WC
PD
0.96
0.57
PE
0.62
0.02
SR
0.96
0.55
Bromeliads
RS
PD
0.91
0.37
PE
0.75
0.03
SR
0.92
0.37
WC
PD
0.88
0.19
PE
0.74
0.02
SR
0.89
0.19
Bignones
RS
PD
0.94
0.58
PE
0.57
0.10
SR
0.96
0.72
WC
PD
0.94
0.59
PE
0.57
0.10
SR
0.96
0.74
Numbers in bold have higher predictive power when comparing RS and WC for a single group
11 Predicting Patterns of Plant Diversity and Endemism in the Tropics Using Remote…