

241
(r
2
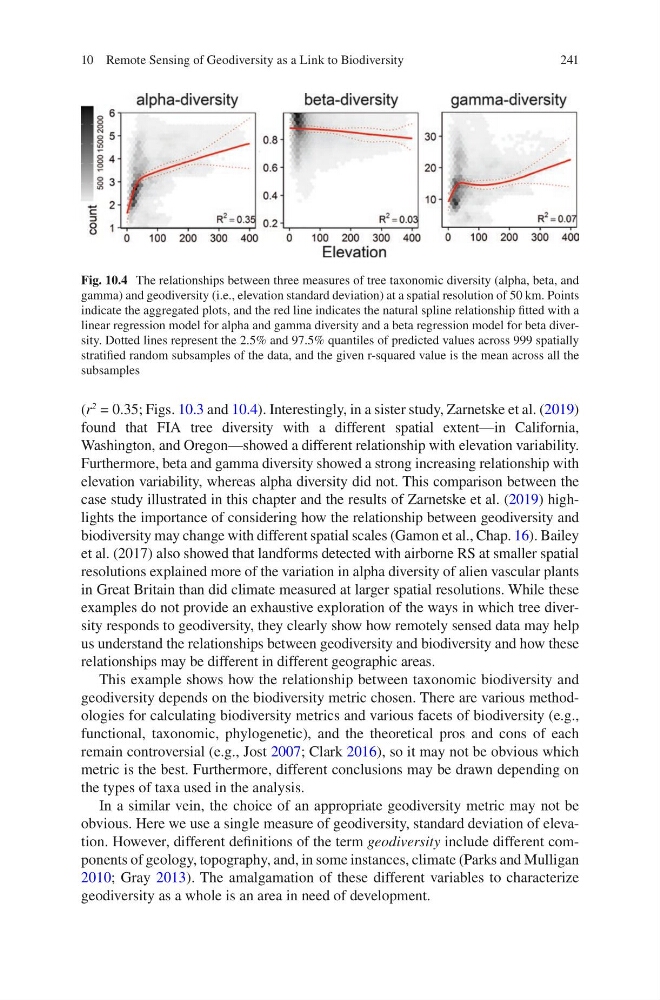
= 0.35; Figs. 10.3 and 10.4). Interestingly, in a sister study, Zarnetske et al. (2019)
found that FIA tree diversity with a different spatial extent—in California,
Washington, and Oregon—showed a different relationship with elevation variability.
Furthermore, beta and gamma diversity showed a strong increasing relationship with
elevation variability, whereas alpha diversity did not. This comparison between the
case study illustrated in this chapter and the results of Zarnetske et al. (2019) highlights the importance of considering how the relationship between geodiversity and
biodiversity may change with different spatial scales (Gamon et al., Chap. 16). Bailey
et al. (2017) also showed that landforms detected with airborne RS at smaller spatial
resolutions explained more of the variation in alpha diversity of alien vascular plants
in Great Britain than did climate measured at larger spatial resolutions. While these
examples do not provide an exhaustive exploration of the ways in which tree diversity responds to geodiversity, they clearly show how remotely sensed data may help
us understand the relationships between geodiversity and biodiversity and how these
relationships may be different in different geographic areas.
This example shows how the relationship between taxonomic biodiversity and
geodiversity depends on the biodiversity metric chosen. There are various methodologies for calculating biodiversity metrics and various facets of biodiversity (e.g.,
functional, taxonomic, phylogenetic), and the theoretical pros and cons of each
remain controversial (e.g., Jost 2007; Clark 2016), so it may not be obvious which
metric is the best. Furthermore, different conclusions may be drawn depending on
the types of taxa used in the analysis.
In a similar vein, the choice of an appropriate geodiversity metric may not be
obvious. Here we use a single measure of geodiversity, standard deviation of elevation. However, different definitions of the term geodiversity include different components of geology, topography, and, in some instances, climate (Parks and Mulligan
2010; Gray 2013). The amalgamation of these different variables to characterize
geodiversity as a whole is an area in need of development.
Fig. 10.4 The relationships between three measures of tree taxonomic diversity (alpha, beta, and
gamma) and geodiversity (i.e., elevation standard deviation) at a spatial resolution of 50 km. Points
indicate the aggregated plots, and the red line indicates the natural spline relationship fitted with a
linear regression model for alpha and gamma diversity and a beta regression model for beta diversity. Dotted lines represent the 2.5% and 97.5% quantiles of predicted values across 999 spatially
stratified random subsamples of the data, and the given r-squared value is the mean across all the
subsamples
10 Remote Sensing of Geodiversity as a Link to Biodiversity
(r
2
= 0.35; Figs. 10.3 and 10.4). Interestingly, in a sister study, Zarnetske et al. (2019)
found that FIA tree diversity with a different spatial extent—in California,
Washington, and Oregon—showed a different relationship with elevation variability.
Furthermore, beta and gamma diversity showed a strong increasing relationship with
elevation variability, whereas alpha diversity did not. This comparison between the
case study illustrated in this chapter and the results of Zarnetske et al. (2019) highlights the importance of considering how the relationship between geodiversity and
biodiversity may change with different spatial scales (Gamon et al., Chap. 16). Bailey
et al. (2017) also showed that landforms detected with airborne RS at smaller spatial
resolutions explained more of the variation in alpha diversity of alien vascular plants
in Great Britain than did climate measured at larger spatial resolutions. While these
examples do not provide an exhaustive exploration of the ways in which tree diversity responds to geodiversity, they clearly show how remotely sensed data may help
us understand the relationships between geodiversity and biodiversity and how these
relationships may be different in different geographic areas.
This example shows how the relationship between taxonomic biodiversity and
geodiversity depends on the biodiversity metric chosen. There are various methodologies for calculating biodiversity metrics and various facets of biodiversity (e.g.,
functional, taxonomic, phylogenetic), and the theoretical pros and cons of each
remain controversial (e.g., Jost 2007; Clark 2016), so it may not be obvious which
metric is the best. Furthermore, different conclusions may be drawn depending on
the types of taxa used in the analysis.
In a similar vein, the choice of an appropriate geodiversity metric may not be
obvious. Here we use a single measure of geodiversity, standard deviation of elevation. However, different definitions of the term geodiversity include different components of geology, topography, and, in some instances, climate (Parks and Mulligan
2010; Gray 2013). The amalgamation of these different variables to characterize
geodiversity as a whole is an area in need of development.
Fig. 10.4 The relationships between three measures of tree taxonomic diversity (alpha, beta, and
gamma) and geodiversity (i.e., elevation standard deviation) at a spatial resolution of 50 km. Points
indicate the aggregated plots, and the red line indicates the natural spline relationship fitted with a
linear regression model for alpha and gamma diversity and a beta regression model for beta diversity. Dotted lines represent the 2.5% and 97.5% quantiles of predicted values across 999 spatially
stratified random subsamples of the data, and the given r-squared value is the mean across all the
subsamples
10 Remote Sensing of Geodiversity as a Link to Biodiversity