

211
only region where three live oak species co-occur. Uncertainty maps (Fig. 9.6e–h)
show that uncertainty values for the simpler S-RS models (Fig. 9.6e) are lower
when compared with the other models and WorldClim models tend to show high
uncertainty values across south-central North America (e.g., Texas).
The geographical relationship between the individual species models made for
the four combinations of environmental predictors varied depending on the species
evaluated (Table 9.3), although they show positive relationships in all cases. In general, spatial relationships between species models from S-RS products (i.e., S-RS vs
S-RS2) and WorldClim (i.e., WC10 vs WC25) were strongly correlated (see also
Paz et al., Chap. 11), while the relationship between models made from S-RS products
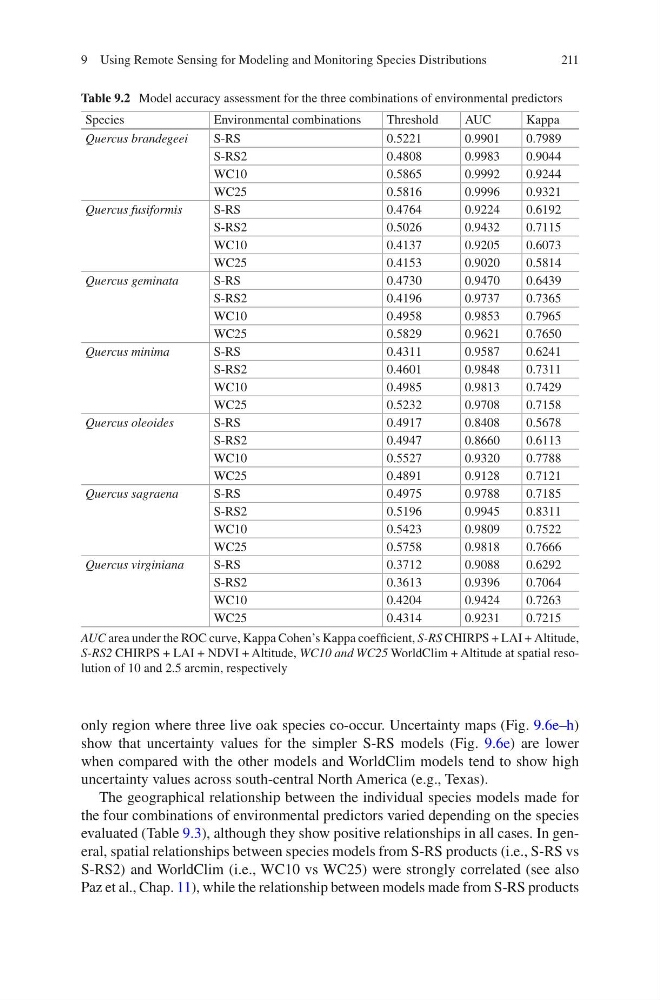
Table 9.2 Model accuracy assessment for the three combinations of environmental predictors
Species
Environmental combinations
Threshold
AUC
Kappa
Quercus brandegeei
S-RS
0.5221
0.9901
0.7989
S-RS2
0.4808
0.9983
0.9044
WC10
0.5865
0.9992
0.9244
WC25
0.5816
0.9996
0.9321
Quercus fusiformis
S-RS
0.4764
0.9224
0.6192
S-RS2
0.5026
0.9432
0.7115
WC10
0.4137
0.9205
0.6073
WC25
0.4153
0.9020
0.5814
Quercus geminata
S-RS
0.4730
0.9470
0.6439
S-RS2
0.4196
0.9737
0.7365
WC10
0.4958
0.9853
0.7965
WC25
0.5829
0.9621
0.7650
Quercus minima
S-RS
0.4311
0.9587
0.6241
S-RS2
0.4601
0.9848
0.7311
WC10
0.4985
0.9813
0.7429
WC25
0.5232
0.9708
0.7158
Quercus oleoides
S-RS
0.4917
0.8408
0.5678
S-RS2
0.4947
0.8660
0.6113
WC10
0.5527
0.9320
0.7788
WC25
0.4891
0.9128
0.7121
Quercus sagraena
S-RS
0.4975
0.9788
0.7185
S-RS2
0.5196
0.9945
0.8311
WC10
0.5423
0.9809
0.7522
WC25
0.5758
0.9818
0.7666
Quercus virginiana
S-RS
0.3712
0.9088
0.6292
S-RS2
0.3613
0.9396
0.7064
WC10
0.4204
0.9424
0.7263
WC25
0.4314
0.9231
0.7215
AUC area under the ROC curve, Kappa Cohen’s Kappa coefficient, S-RS CHIRPS + LAI + Altitude,
S-RS2 CHIRPS + LAI + NDVI + Altitude, WC10 and WC25 WorldClim + Altitude at spatial resolution of 10 and 2.5 arcmin, respectively
9 Using Remote Sensing for Modeling and Monitoring Species Distributions
only region where three live oak species co-occur. Uncertainty maps (Fig. 9.6e–h)
show that uncertainty values for the simpler S-RS models (Fig. 9.6e) are lower
when compared with the other models and WorldClim models tend to show high
uncertainty values across south-central North America (e.g., Texas).
The geographical relationship between the individual species models made for
the four combinations of environmental predictors varied depending on the species
evaluated (Table 9.3), although they show positive relationships in all cases. In general, spatial relationships between species models from S-RS products (i.e., S-RS vs
S-RS2) and WorldClim (i.e., WC10 vs WC25) were strongly correlated (see also
Paz et al., Chap. 11), while the relationship between models made from S-RS products
Table 9.2 Model accuracy assessment for the three combinations of environmental predictors
Species
Environmental combinations
Threshold
AUC
Kappa
Quercus brandegeei
S-RS
0.5221
0.9901
0.7989
S-RS2
0.4808
0.9983
0.9044
WC10
0.5865
0.9992
0.9244
WC25
0.5816
0.9996
0.9321
Quercus fusiformis
S-RS
0.4764
0.9224
0.6192
S-RS2
0.5026
0.9432
0.7115
WC10
0.4137
0.9205
0.6073
WC25
0.4153
0.9020
0.5814
Quercus geminata
S-RS
0.4730
0.9470
0.6439
S-RS2
0.4196
0.9737
0.7365
WC10
0.4958
0.9853
0.7965
WC25
0.5829
0.9621
0.7650
Quercus minima
S-RS
0.4311
0.9587
0.6241
S-RS2
0.4601
0.9848
0.7311
WC10
0.4985
0.9813
0.7429
WC25
0.5232
0.9708
0.7158
Quercus oleoides
S-RS
0.4917
0.8408
0.5678
S-RS2
0.4947
0.8660
0.6113
WC10
0.5527
0.9320
0.7788
WC25
0.4891
0.9128
0.7121
Quercus sagraena
S-RS
0.4975
0.9788
0.7185
S-RS2
0.5196
0.9945
0.8311
WC10
0.5423
0.9809
0.7522
WC25
0.5758
0.9818
0.7666
Quercus virginiana
S-RS
0.3712
0.9088
0.6292
S-RS2
0.3613
0.9396
0.7064
WC10
0.4204
0.9424
0.7263
WC25
0.4314
0.9231
0.7215
AUC area under the ROC curve, Kappa Cohen’s Kappa coefficient, S-RS CHIRPS + LAI + Altitude,
S-RS2 CHIRPS + LAI + NDVI + Altitude, WC10 and WC25 WorldClim + Altitude at spatial resolution of 10 and 2.5 arcmin, respectively
9 Using Remote Sensing for Modeling and Monitoring Species Distributions