

212
and WorldClim data varied slightly; the simpler models made from the S-RS data
showed stronger spatial relationship to the WorldClim models (Table 9.3).
Interestingly, the spatial relationships increased as a function of increasing the species
potential distributions. For example, weaker spatial relationships (r = 0.5384 for
S-RS/WC10 and r = 0.6360 for S-RS/WC25) were found for Quercus brandegeei,
and stronger spatial relationships were found for dwarf live oak (Quercus minima;
r = 0.8150 for S-RS/WC10 and r = 0.8332) and southern live oak (Quercus virginiana; r = 0.8872 for S-RS/WC10 and r = 0.8523 for S-RS/WC25) that are distributed across the southeastern United States (Fig. 9.5LL–Ñ and Fig. 9.5W–Z,
respectively).
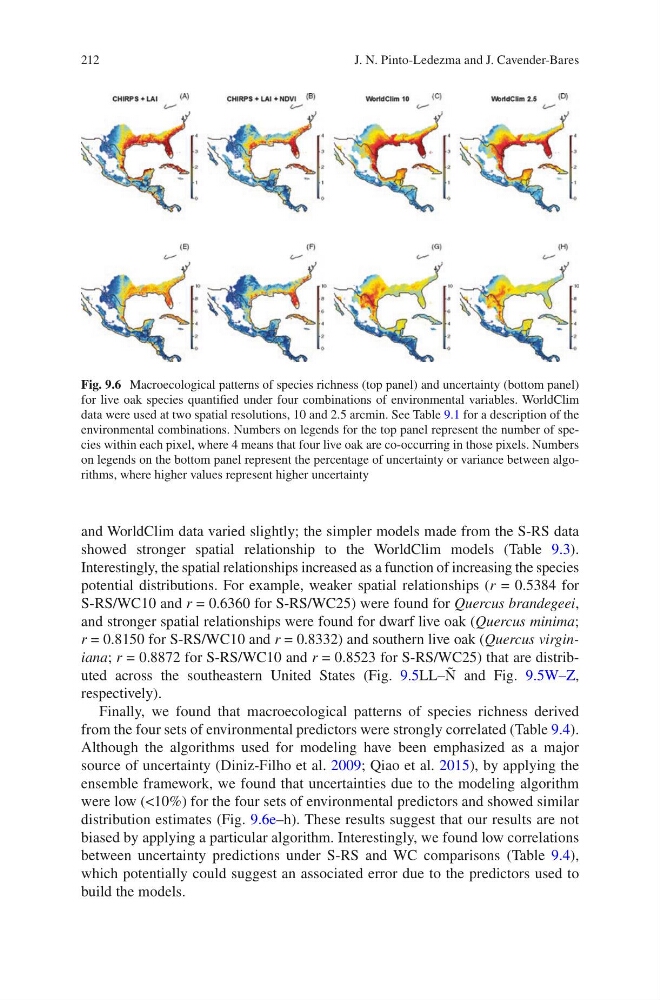
Finally, we found that macroecological patterns of species richness derived
from the four sets of environmental predictors were strongly correlated (Table 9.4).
Although the algorithms used for modeling have been emphasized as a major
source of uncertainty (Diniz-Filho et al. 2009; Qiao et al. 2015), by applying the
ensemble framework, we found that uncertainties due to the modeling algorithm
were low (<10%) for the four sets of environmental predictors and showed similar
distribution estimates (Fig. 9.6e–h). These results suggest that our results are not
biased by applying a particular algorithm. Interestingly, we found low correlations
between uncertainty predictions under S-RS and WC comparisons (Table 9.4),
which potentially could suggest an associated error due to the predictors used to
build the models.
Fig. 9.6 Macroecological patterns of species richness (top panel) and uncertainty (bottom panel)
for live oak species quantified under four combinations of environmental variables. WorldClim
data were used at two spatial resolutions, 10 and 2.5 arcmin. See Table 9.1 for a description of the
environmental combinations. Numbers on legends for the top panel represent the number of species within each pixel, where 4 means that four live oak are co-occurring in those pixels. Numbers
on legends on the bottom panel represent the percentage of uncertainty or variance between algorithms, where higher values represent higher uncertainty
J. N. Pinto-Ledezma and J. Cavender-Bares
and WorldClim data varied slightly; the simpler models made from the S-RS data
showed stronger spatial relationship to the WorldClim models (Table 9.3).
Interestingly, the spatial relationships increased as a function of increasing the species
potential distributions. For example, weaker spatial relationships (r = 0.5384 for
S-RS/WC10 and r = 0.6360 for S-RS/WC25) were found for Quercus brandegeei,
and stronger spatial relationships were found for dwarf live oak (Quercus minima;
r = 0.8150 for S-RS/WC10 and r = 0.8332) and southern live oak (Quercus virginiana; r = 0.8872 for S-RS/WC10 and r = 0.8523 for S-RS/WC25) that are distributed across the southeastern United States (Fig. 9.5LL–Ñ and Fig. 9.5W–Z,
respectively).
Finally, we found that macroecological patterns of species richness derived
from the four sets of environmental predictors were strongly correlated (Table 9.4).
Although the algorithms used for modeling have been emphasized as a major
source of uncertainty (Diniz-Filho et al. 2009; Qiao et al. 2015), by applying the
ensemble framework, we found that uncertainties due to the modeling algorithm
were low (<10%) for the four sets of environmental predictors and showed similar
distribution estimates (Fig. 9.6e–h). These results suggest that our results are not
biased by applying a particular algorithm. Interestingly, we found low correlations
between uncertainty predictions under S-RS and WC comparisons (Table 9.4),
which potentially could suggest an associated error due to the predictors used to
build the models.
Fig. 9.6 Macroecological patterns of species richness (top panel) and uncertainty (bottom panel)
for live oak species quantified under four combinations of environmental variables. WorldClim
data were used at two spatial resolutions, 10 and 2.5 arcmin. See Table 9.1 for a description of the
environmental combinations. Numbers on legends for the top panel represent the number of species within each pixel, where 4 means that four live oak are co-occurring in those pixels. Numbers
on legends on the bottom panel represent the percentage of uncertainty or variance between algorithms, where higher values represent higher uncertainty
J. N. Pinto-Ledezma and J. Cavender-Bares