

207
provide information on net primary productivity, dynamics of the growing season,
and vegetation seasonality, all potentially important variables for characterizing
plant species ranges (Myneni et al. 2002; Saatchi et al. 2008). All data processing
and metric calculations were performed in R v3.5 (R Core Team 2018) using customized scripts and core functions from the packages raster (Hijmans 2018),
gdalUtils (Greenberg and Mattiuzzi 2018), and rgdal (Bivand et al. 2018). R scripts
for data processing and metric calculations can be found at https://github.com/jesusNPL/RS-SDM_ENM.
9.3.1.3 Modeling Procedure
To model the ecological niche and distribution for oak species, we used an ensemble
framework—prediction of a niche or a distributional area made by combining
results of different modeling algorithms (Araújo and New 2007; Diniz-Filho et al.
2009). Within this framework we fit six species models and projected potential
distributions for current environmental conditions for both environmental data sets
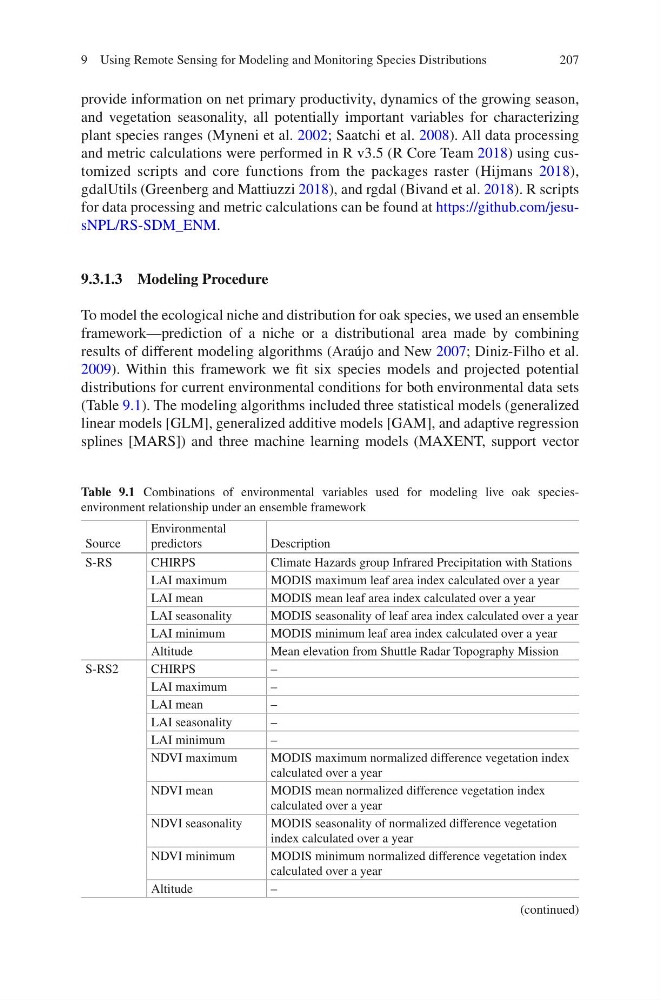
(Table 9.1). The modeling algorithms included three statistical models (generalized
linear models [GLM], generalized additive models [GAM], and adaptive regression
splines [MARS]) and three machine learning models (MAXENT, support vector
Table 9.1 Combinations of environmental variables used for modeling live oak speciesenvironment relationship under an ensemble framework
Source
Environmental
predictors
Description
S-RS
CHIRPS
Climate Hazards group Infrared Precipitation with Stations
LAI maximum
MODIS maximum leaf area index calculated over a year
LAI mean
MODIS mean leaf area index calculated over a year
LAI seasonality
MODIS seasonality of leaf area index calculated over a year
LAI minimum
MODIS minimum leaf area index calculated over a year
Altitude
Mean elevation from Shuttle Radar Topography Mission
S-RS2
CHIRPS
–
LAI maximum
–
LAI mean
–
LAI seasonality
–
LAI minimum
–
NDVI maximum
MODIS maximum normalized difference vegetation index
calculated over a year
NDVI mean
MODIS mean normalized difference vegetation index
calculated over a year
NDVI seasonality
MODIS seasonality of normalized difference vegetation
index calculated over a year
NDVI minimum
MODIS minimum normalized difference vegetation index
calculated over a year
Altitude
–
(continued)
9 Using Remote Sensing for Modeling and Monitoring Species Distributions
provide information on net primary productivity, dynamics of the growing season,
and vegetation seasonality, all potentially important variables for characterizing
plant species ranges (Myneni et al. 2002; Saatchi et al. 2008). All data processing
and metric calculations were performed in R v3.5 (R Core Team 2018) using customized scripts and core functions from the packages raster (Hijmans 2018),
gdalUtils (Greenberg and Mattiuzzi 2018), and rgdal (Bivand et al. 2018). R scripts
for data processing and metric calculations can be found at https://github.com/jesusNPL/RS-SDM_ENM.
9.3.1.3 Modeling Procedure
To model the ecological niche and distribution for oak species, we used an ensemble
framework—prediction of a niche or a distributional area made by combining
results of different modeling algorithms (Araújo and New 2007; Diniz-Filho et al.
2009). Within this framework we fit six species models and projected potential
distributions for current environmental conditions for both environmental data sets
(Table 9.1). The modeling algorithms included three statistical models (generalized
linear models [GLM], generalized additive models [GAM], and adaptive regression
splines [MARS]) and three machine learning models (MAXENT, support vector
Table 9.1 Combinations of environmental variables used for modeling live oak speciesenvironment relationship under an ensemble framework
Source
Environmental
predictors
Description
S-RS
CHIRPS
Climate Hazards group Infrared Precipitation with Stations
LAI maximum
MODIS maximum leaf area index calculated over a year
LAI mean
MODIS mean leaf area index calculated over a year
LAI seasonality
MODIS seasonality of leaf area index calculated over a year
LAI minimum
MODIS minimum leaf area index calculated over a year
Altitude
Mean elevation from Shuttle Radar Topography Mission
S-RS2
CHIRPS
–
LAI maximum
–
LAI mean
–
LAI seasonality
–
LAI minimum
–
NDVI maximum
MODIS maximum normalized difference vegetation index
calculated over a year
NDVI mean
MODIS mean normalized difference vegetation index
calculated over a year
NDVI seasonality
MODIS seasonality of normalized difference vegetation
index calculated over a year
NDVI minimum
MODIS minimum normalized difference vegetation index
calculated over a year
Altitude
–
(continued)
9 Using Remote Sensing for Modeling and Monitoring Species Distributions