

206
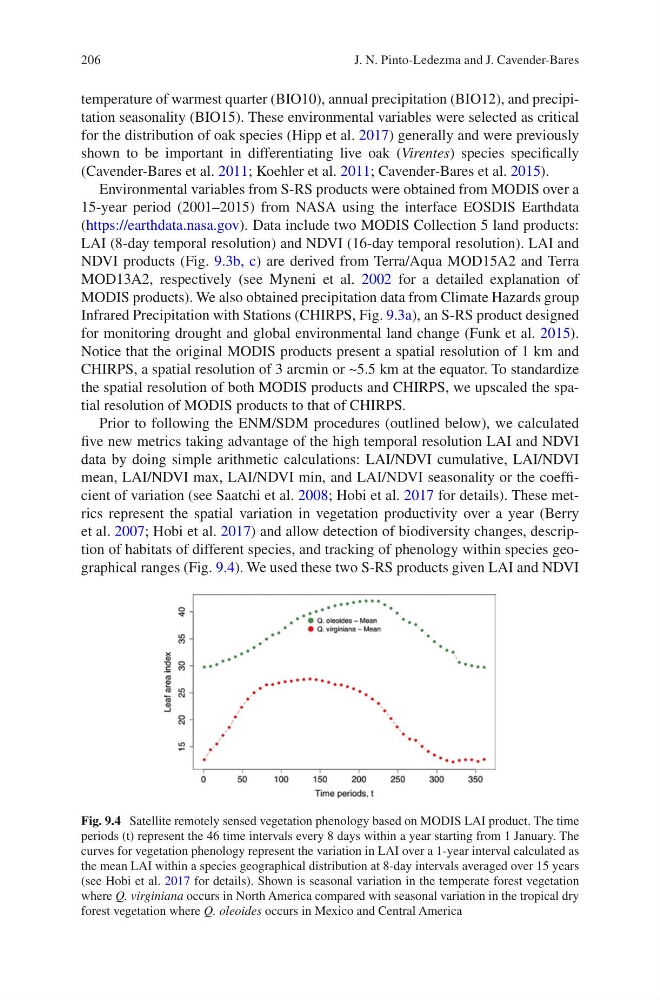
Fig. 9.4 Satellite remotely sensed vegetation phenology based on MODIS LAI product. The time
periods (t) represent the 46 time intervals every 8 days within a year starting from 1 January. The
curves for vegetation phenology represent the variation in LAI over a 1-year interval calculated as
the mean LAI within a species geographical distribution at 8-day intervals averaged over 15 years
(see Hobi et al. 2017 for details). Shown is seasonal variation in the temperate forest vegetation
where Q. virginiana occurs in North America compared with seasonal variation in the tropical dry
forest vegetation where Q. oleoides occurs in Mexico and Central America
temperature of warmest quarter (BIO10), annual precipitation (BIO12), and precipitation seasonality (BIO15). These environmental variables were selected as critical
for the distribution of oak species (Hipp et al. 2017) generally and were previously
shown to be important in differentiating live oak (Virentes) species specifically
(Cavender- Bares et al. 2011; Koehler et al. 2011; Cavender-Bares et al. 2015).
Environmental variables from S-RS products were obtained from MODIS over a
15-year period (2001–2015) from NASA using the interface EOSDIS Earthdata
(https://earthdata.nasa.gov). Data include two MODIS Collection 5 land products:
LAI (8-day temporal resolution) and NDVI (16-day temporal resolution). LAI and
NDVI products (Fig. 9.3b, c) are derived from Terra/Aqua MOD15A2 and Terra
MOD13A2, respectively (see Myneni et al. 2002 for a detailed explanation of
MODIS products). We also obtained precipitation data from Climate Hazards group
Infrared Precipitation with Stations (CHIRPS, Fig. 9.3a), an S-RS product designed
for monitoring drought and global environmental land change (Funk et al. 2015).
Notice that the original MODIS products present a spatial resolution of 1 km and
CHIRPS, a spatial resolution of 3 arcmin or ~5.5 km at the equator. To standardize
the spatial resolution of both MODIS products and CHIRPS, we upscaled the spatial resolution of MODIS products to that of CHIRPS.
Prior to following the ENM/SDM procedures (outlined below), we calculated
five new metrics taking advantage of the high temporal resolution LAI and NDVI
data by doing simple arithmetic calculations: LAI/NDVI cumulative, LAI/NDVI
mean, LAI/NDVI max, LAI/NDVI min, and LAI/NDVI seasonality or the coefficient of variation (see Saatchi et al. 2008; Hobi et al. 2017 for details). These metrics represent the spatial variation in vegetation productivity over a year (Berry
et al. 2007; Hobi et al. 2017) and allow detection of biodiversity changes, description of habitats of different species, and tracking of phenology within species geographical ranges (Fig. 9.4). We used these two S-RS products given LAI and NDVI
J. N. Pinto-Ledezma and J. Cavender-Bares
Fig. 9.4 Satellite remotely sensed vegetation phenology based on MODIS LAI product. The time
periods (t) represent the 46 time intervals every 8 days within a year starting from 1 January. The
curves for vegetation phenology represent the variation in LAI over a 1-year interval calculated as
the mean LAI within a species geographical distribution at 8-day intervals averaged over 15 years
(see Hobi et al. 2017 for details). Shown is seasonal variation in the temperate forest vegetation
where Q. virginiana occurs in North America compared with seasonal variation in the tropical dry
forest vegetation where Q. oleoides occurs in Mexico and Central America
temperature of warmest quarter (BIO10), annual precipitation (BIO12), and precipitation seasonality (BIO15). These environmental variables were selected as critical
for the distribution of oak species (Hipp et al. 2017) generally and were previously
shown to be important in differentiating live oak (Virentes) species specifically
(Cavender- Bares et al. 2011; Koehler et al. 2011; Cavender-Bares et al. 2015).
Environmental variables from S-RS products were obtained from MODIS over a
15-year period (2001–2015) from NASA using the interface EOSDIS Earthdata
(https://earthdata.nasa.gov). Data include two MODIS Collection 5 land products:
LAI (8-day temporal resolution) and NDVI (16-day temporal resolution). LAI and
NDVI products (Fig. 9.3b, c) are derived from Terra/Aqua MOD15A2 and Terra
MOD13A2, respectively (see Myneni et al. 2002 for a detailed explanation of
MODIS products). We also obtained precipitation data from Climate Hazards group
Infrared Precipitation with Stations (CHIRPS, Fig. 9.3a), an S-RS product designed
for monitoring drought and global environmental land change (Funk et al. 2015).
Notice that the original MODIS products present a spatial resolution of 1 km and
CHIRPS, a spatial resolution of 3 arcmin or ~5.5 km at the equator. To standardize
the spatial resolution of both MODIS products and CHIRPS, we upscaled the spatial resolution of MODIS products to that of CHIRPS.
Prior to following the ENM/SDM procedures (outlined below), we calculated
five new metrics taking advantage of the high temporal resolution LAI and NDVI
data by doing simple arithmetic calculations: LAI/NDVI cumulative, LAI/NDVI
mean, LAI/NDVI max, LAI/NDVI min, and LAI/NDVI seasonality or the coefficient of variation (see Saatchi et al. 2008; Hobi et al. 2017 for details). These metrics represent the spatial variation in vegetation productivity over a year (Berry
et al. 2007; Hobi et al. 2017) and allow detection of biodiversity changes, description of habitats of different species, and tracking of phenology within species geographical ranges (Fig. 9.4). We used these two S-RS products given LAI and NDVI
J. N. Pinto-Ledezma and J. Cavender-Bares