

208
machines [SVM], and Random Forest [RF]). A description for each algorithm is
detailed in Franklin (2010) (see also Peterson et al. 2011). All algorithms were fit in
R and used the packages dismo (Hijmans et al. 2017), kernlab (Karatzoglou et al.
2004), randomForest (Liaw and Wiener 2002), mgcv (Wood 2006), and earth
(Milborrow 2016).
Within our ensemble framework, species’ ecological niches are modeled using
the six algorithms by fitting the occurrences of a single species and the predictors.
The resulting six species models (one for each algorithm) are stacked into a single
species model by averaging all models (Araújo and New 2007). We chose this
approach because a major source of uncertainty in ENM/SDM arises from the algorithm used for modeling (Diniz-Filho et al. 2009; Qiao et al. 2015) and because the
choice of the “best” modeling algorithm depends on the aims of the modeling applications (Peterson et al. 2011). Finally, using the stacked species models, we estimated macroecological patterns of species richness and the uncertainty associated
with model parametrization. These patterns are less interesting in their own right for
a small clade with only seven species, but they demonstrate an effective approach
that can be applied to much larger groups of species.
We estimated live oak species richness by summing the projected potential species distributions; uncertainty was estimated as the variance attributable to the
source of uncertainty (i.e., algorithms and their interactions) by performing a
one- way analysis of variance (ANOVA) without replicates (Sokal and Rohlf 1995).
The resulting uncertainty map shows regions with low and high uncertainty associated
with the source of uncertainty (i.e., algorithm).
Statistical Analyses
To explore the performance of environmental data derived from RS for ENM/SDM
compared to traditionally used environmental data from climatic variables (e.g.,
WorldClim), we evaluated the relationship between the modeled ecological niches
from: (1) S-RS products; and (2) environmental variables from WorldClim. In doing
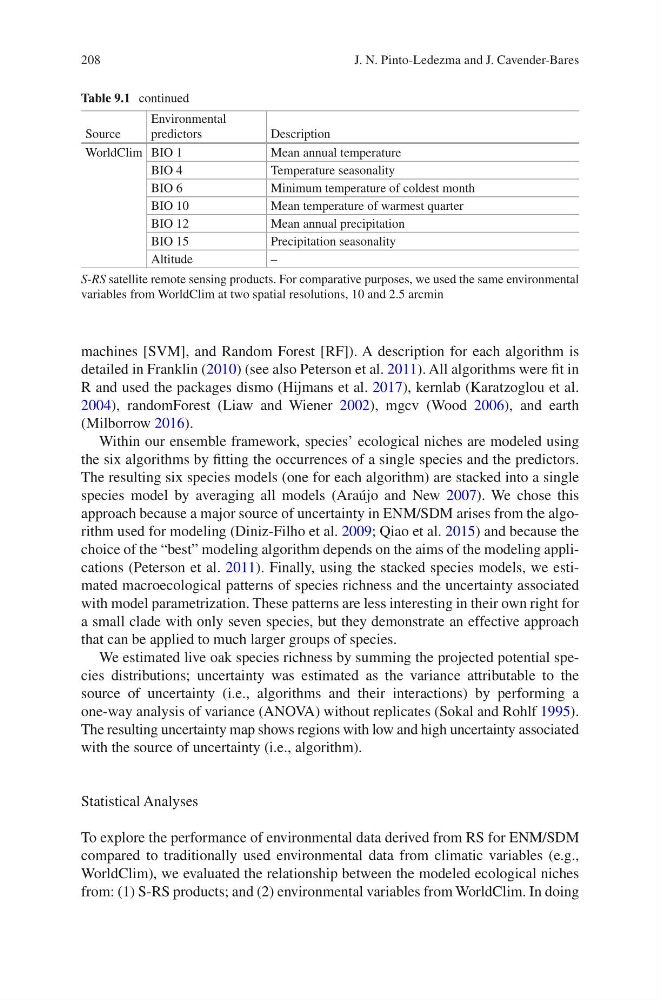
Source
Environmental
predictors
Description
WorldClim BIO 1
Mean annual temperature
BIO 4
Temperature seasonality
BIO 6
Minimum temperature of coldest month
BIO 10
Mean temperature of warmest quarter
BIO 12
Mean annual precipitation
BIO 15
Precipitation seasonality
Altitude
–
S-RS satellite remote sensing products. For comparative purposes, we used the same environmental
variables from WorldClim at two spatial resolutions, 10 and 2.5 arcmin
Table 9.1 continued
J. N. Pinto-Ledezma and J. Cavender-Bares
machines [SVM], and Random Forest [RF]). A description for each algorithm is
detailed in Franklin (2010) (see also Peterson et al. 2011). All algorithms were fit in
R and used the packages dismo (Hijmans et al. 2017), kernlab (Karatzoglou et al.
2004), randomForest (Liaw and Wiener 2002), mgcv (Wood 2006), and earth
(Milborrow 2016).
Within our ensemble framework, species’ ecological niches are modeled using
the six algorithms by fitting the occurrences of a single species and the predictors.
The resulting six species models (one for each algorithm) are stacked into a single
species model by averaging all models (Araújo and New 2007). We chose this
approach because a major source of uncertainty in ENM/SDM arises from the algorithm used for modeling (Diniz-Filho et al. 2009; Qiao et al. 2015) and because the
choice of the “best” modeling algorithm depends on the aims of the modeling applications (Peterson et al. 2011). Finally, using the stacked species models, we estimated macroecological patterns of species richness and the uncertainty associated
with model parametrization. These patterns are less interesting in their own right for
a small clade with only seven species, but they demonstrate an effective approach
that can be applied to much larger groups of species.
We estimated live oak species richness by summing the projected potential species distributions; uncertainty was estimated as the variance attributable to the
source of uncertainty (i.e., algorithms and their interactions) by performing a
one- way analysis of variance (ANOVA) without replicates (Sokal and Rohlf 1995).
The resulting uncertainty map shows regions with low and high uncertainty associated
with the source of uncertainty (i.e., algorithm).
Statistical Analyses
To explore the performance of environmental data derived from RS for ENM/SDM
compared to traditionally used environmental data from climatic variables (e.g.,
WorldClim), we evaluated the relationship between the modeled ecological niches
from: (1) S-RS products; and (2) environmental variables from WorldClim. In doing
Source
Environmental
predictors
Description
WorldClim BIO 1
Mean annual temperature
BIO 4
Temperature seasonality
BIO 6
Minimum temperature of coldest month
BIO 10
Mean temperature of warmest quarter
BIO 12
Mean annual precipitation
BIO 15
Precipitation seasonality
Altitude
–
S-RS satellite remote sensing products. For comparative purposes, we used the same environmental
variables from WorldClim at two spatial resolutions, 10 and 2.5 arcmin
Table 9.1 continued
J. N. Pinto-Ledezma and J. Cavender-Bares