

127
However, the mapping products generated vary based on differences in the base
map scale used, observer bias, or agency emphasis (Kosiba et al. 2018). Products
also vary year to year based on timing of flight and the visibility of different stress
symptoms (e.g., early season vs. late season defoliators). Further, only decline
symptoms that are severe enough, and in large enough patches to be visible to an
observer in an aircraft traveling approximately 100 knots from an altitude of
1000–3000 feet above ground level, are mapped. As such, aerial sketch mapping
can be highly subjective and should only be regarded as a coarse “snapshot” of
landscape-level forest health.
Multispectral Sensors Terrestrial satellite RS began with the launch of the Landsat
mission (then called the Earth Resources Technology Satellite (ERTS)) in 1972.
Designed to supply regular images of Earth’s surface, with multispectral bands designed
to capture biospheric processes at medium-high spatial resolution, Landsat-1 enabled a
revolution in terrestrial research (Williams et al. 2006). With continuous coverage since
the 1972 launch, the family of Landsat sensors is particularly useful for studying forest
change over time across regional to global scales (Fig. 6.7).
Initially, the broad, multispectral bands on the Landsat sensors were used to
assess relative vegetative density, or “greenness.” This was made possible by targeting the near-infrared (NIR) portions of the electromagnetic spectrum in addition to
visible wavelengths. This “near-infrared plateau” is a region of strong reflectance in
vegetation and is distinct from many other surface features such as soil, rock, and
water, making it particularly useful for distinguishing vegetation from non-vegetative land cover types or assessing the relative amount of vegetation within mixed
pixels. It is also highly responsive to common stress symptoms such as defoliation,
chlorosis, and decreases in canopy density. Over the decades, scientists have developed a suite of vegetation indices to quantify vegetation condition and biophysical
attributes (Table 6.1) that have been commonly used to assess changes in canopy
cover (e.g., deforestation) and widespread defoliation or mortality.
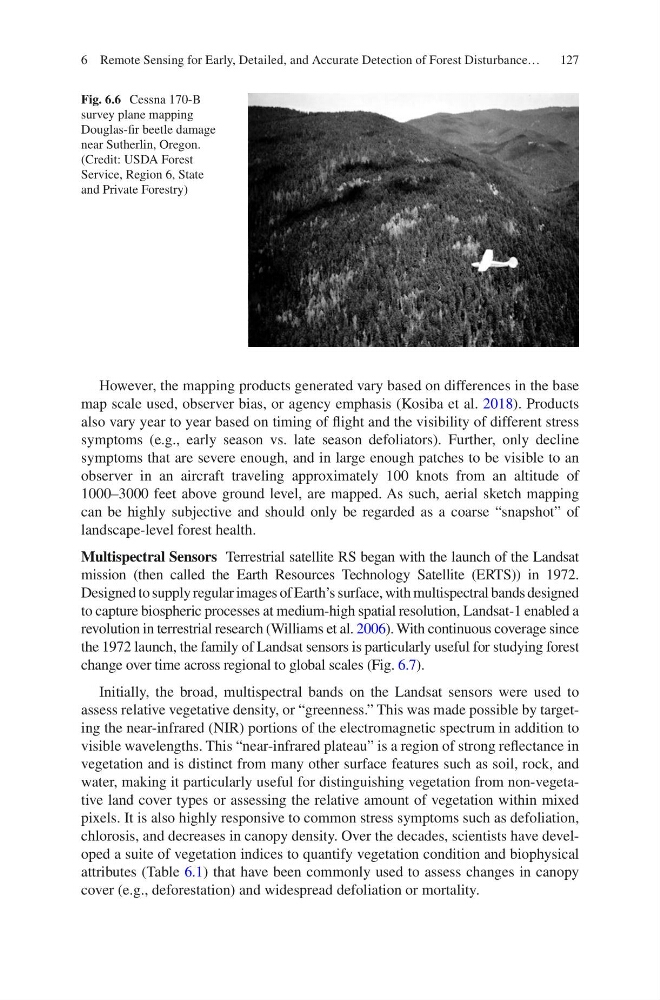
Fig. 6.6 Cessna 170-B
survey plane mapping
Douglas-fir beetle damage
near Sutherlin, Oregon.
(Credit: USDA Forest
Service, Region 6, State
and Private Forestry)
6 Remote Sensing for Early, Detailed, and Accurate Detection of Forest Disturbance…
However, the mapping products generated vary based on differences in the base
map scale used, observer bias, or agency emphasis (Kosiba et al. 2018). Products
also vary year to year based on timing of flight and the visibility of different stress
symptoms (e.g., early season vs. late season defoliators). Further, only decline
symptoms that are severe enough, and in large enough patches to be visible to an
observer in an aircraft traveling approximately 100 knots from an altitude of
1000–3000 feet above ground level, are mapped. As such, aerial sketch mapping
can be highly subjective and should only be regarded as a coarse “snapshot” of
landscape-level forest health.
Multispectral Sensors Terrestrial satellite RS began with the launch of the Landsat
mission (then called the Earth Resources Technology Satellite (ERTS)) in 1972.
Designed to supply regular images of Earth’s surface, with multispectral bands designed
to capture biospheric processes at medium-high spatial resolution, Landsat-1 enabled a
revolution in terrestrial research (Williams et al. 2006). With continuous coverage since
the 1972 launch, the family of Landsat sensors is particularly useful for studying forest
change over time across regional to global scales (Fig. 6.7).
Initially, the broad, multispectral bands on the Landsat sensors were used to
assess relative vegetative density, or “greenness.” This was made possible by targeting the near-infrared (NIR) portions of the electromagnetic spectrum in addition to
visible wavelengths. This “near-infrared plateau” is a region of strong reflectance in
vegetation and is distinct from many other surface features such as soil, rock, and
water, making it particularly useful for distinguishing vegetation from non-vegetative land cover types or assessing the relative amount of vegetation within mixed
pixels. It is also highly responsive to common stress symptoms such as defoliation,
chlorosis, and decreases in canopy density. Over the decades, scientists have developed a suite of vegetation indices to quantify vegetation condition and biophysical
attributes (Table 6.1) that have been commonly used to assess changes in canopy
cover (e.g., deforestation) and widespread defoliation or mortality.
Fig. 6.6 Cessna 170-B
survey plane mapping
Douglas-fir beetle damage
near Sutherlin, Oregon.
(Credit: USDA Forest
Service, Region 6, State
and Private Forestry)
6 Remote Sensing for Early, Detailed, and Accurate Detection of Forest Disturbance…