

126
carbohydrate use associated with maintenance respiration as well as compensatory
growth (e.g., epicormic branching), and seed production, which are often associated
with decline. Significant crown loss exacerbates negative carbon balances, ultimately resulting in tree mortality. Temporary or partial crown dieback may be difficult to detect if it is not widespread, but protracted dieback, especially if it results
in significant tree mortality, could dramatically alter spectral measurements in the
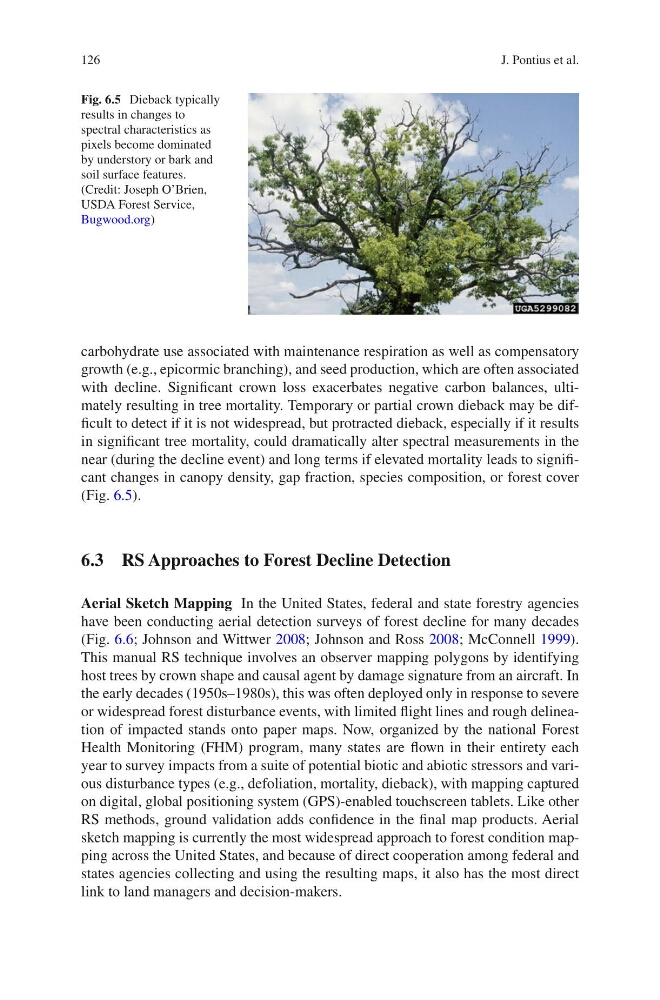
near (during the decline event) and long terms if elevated mortality leads to significant changes in canopy density, gap fraction, species composition, or forest cover
(Fig. 6.5).
6.3 RS Approaches to Forest Decline Detection
Aerial Sketch Mapping In the United States, federal and state forestry agencies
have been conducting aerial detection surveys of forest decline for many decades
(Fig. 6.6; Johnson and Wittwer 2008; Johnson and Ross 2008; McConnell 1999).
This manual RS technique involves an observer mapping polygons by identifying
host trees by crown shape and causal agent by damage signature from an aircraft. In
the early decades (1950s–1980s), this was often deployed only in response to severe
or widespread forest disturbance events, with limited flight lines and rough delineation of impacted stands onto paper maps. Now, organized by the national Forest
Health Monitoring (FHM) program, many states are flown in their entirety each
year to survey impacts from a suite of potential biotic and abiotic stressors and various disturbance types (e.g., defoliation, mortality, dieback), with mapping captured
on digital, global positioning system (GPS)-enabled touchscreen tablets. Like other
RS methods, ground validation adds confidence in the final map products. Aerial
sketch mapping is currently the most widespread approach to forest condition mapping across the United States, and because of direct cooperation among federal and
states agencies collecting and using the resulting maps, it also has the most direct
link to land managers and decision-makers.
Fig. 6.5 Dieback typically
results in changes to
spectral characteristics as
pixels become dominated
by understory or bark and
soil surface features.
(Credit: Joseph O’Brien,
USDA Forest Service,
Bugwood.org)
J. Pontius et al.
carbohydrate use associated with maintenance respiration as well as compensatory
growth (e.g., epicormic branching), and seed production, which are often associated
with decline. Significant crown loss exacerbates negative carbon balances, ultimately resulting in tree mortality. Temporary or partial crown dieback may be difficult to detect if it is not widespread, but protracted dieback, especially if it results
in significant tree mortality, could dramatically alter spectral measurements in the
near (during the decline event) and long terms if elevated mortality leads to significant changes in canopy density, gap fraction, species composition, or forest cover
(Fig. 6.5).
6.3 RS Approaches to Forest Decline Detection
Aerial Sketch Mapping In the United States, federal and state forestry agencies
have been conducting aerial detection surveys of forest decline for many decades
(Fig. 6.6; Johnson and Wittwer 2008; Johnson and Ross 2008; McConnell 1999).
This manual RS technique involves an observer mapping polygons by identifying
host trees by crown shape and causal agent by damage signature from an aircraft. In
the early decades (1950s–1980s), this was often deployed only in response to severe
or widespread forest disturbance events, with limited flight lines and rough delineation of impacted stands onto paper maps. Now, organized by the national Forest
Health Monitoring (FHM) program, many states are flown in their entirety each
year to survey impacts from a suite of potential biotic and abiotic stressors and various disturbance types (e.g., defoliation, mortality, dieback), with mapping captured
on digital, global positioning system (GPS)-enabled touchscreen tablets. Like other
RS methods, ground validation adds confidence in the final map products. Aerial
sketch mapping is currently the most widespread approach to forest condition mapping across the United States, and because of direct cooperation among federal and
states agencies collecting and using the resulting maps, it also has the most direct
link to land managers and decision-makers.
Fig. 6.5 Dieback typically
results in changes to
spectral characteristics as
pixels become dominated
by understory or bark and
soil surface features.
(Credit: Joseph O’Brien,
USDA Forest Service,
Bugwood.org)
J. Pontius et al.