

97
and the representation of the atmosphere are contributing more to this excellent
result. Thus, we have shown that the measured physiological trait variation at leaf
level can be upscaled to canopy level (as observed by IS instruments). We used this
to forward validate IS-derived physiological traits that are the basis of the functional
richness computation in Sect. 4.5.2. This RTM-based link is a key component of our
validation framework because typically field-measured spectra and the traits based
on spectral indices cannot be assumed to be representative for the respective signals
measured at the imaging sensor above the canopy.
4.5.1.2 Spatial Validation
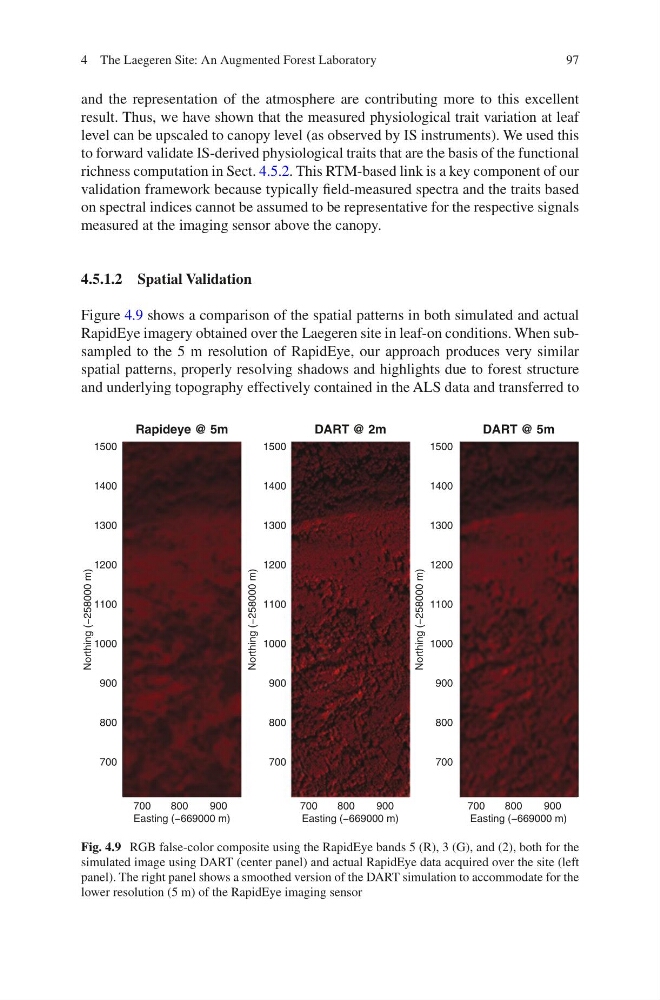
Figure 4.9 shows a comparison of the spatial patterns in both simulated and actual
RapidEye imagery obtained over the Laegeren site in leaf-on conditions. When subsampled to the 5 m resolution of RapidEye, our approach produces very similar
spatial patterns, properly resolving shadows and highlights due to forest structure
and underlying topography effectively contained in the ALS data and transferred to
Northing (−258000 m)
Northing (−258000 m)
Easting (−669000 m)
Easting (−669000 m)
Easting (−669000 m)
1500
1400
1300
1200
1100
1000
900
800
700
1500
1400
1300
1200
1100
1000
900
800
700
1500
1400
1300
1200
1100
1000
900
800
700
700
800
900
700
800
900
700
800
900
Northing (−258000 m)
Rapideye @ 5m
DART @ 2m
DART @ 5m
Fig. 4.9 RGB false-color composite using the RapidEye bands 5 (R), 3 (G), and (2), both for the
simulated image using DART (center panel) and actual RapidEye data acquired over the site (left
panel). The right panel shows a smoothed version of the DART simulation to accommodate for the
lower resolution (5 m) of the RapidEye imaging sensor
4 The Laegeren Site: An Augmented Forest Laboratory
and the representation of the atmosphere are contributing more to this excellent
result. Thus, we have shown that the measured physiological trait variation at leaf
level can be upscaled to canopy level (as observed by IS instruments). We used this
to forward validate IS-derived physiological traits that are the basis of the functional
richness computation in Sect. 4.5.2. This RTM-based link is a key component of our
validation framework because typically field-measured spectra and the traits based
on spectral indices cannot be assumed to be representative for the respective signals
measured at the imaging sensor above the canopy.
4.5.1.2 Spatial Validation
Figure 4.9 shows a comparison of the spatial patterns in both simulated and actual
RapidEye imagery obtained over the Laegeren site in leaf-on conditions. When subsampled to the 5 m resolution of RapidEye, our approach produces very similar
spatial patterns, properly resolving shadows and highlights due to forest structure
and underlying topography effectively contained in the ALS data and transferred to
Northing (−258000 m)
Northing (−258000 m)
Easting (−669000 m)
Easting (−669000 m)
Easting (−669000 m)
1500
1400
1300
1200
1100
1000
900
800
700
1500
1400
1300
1200
1100
1000
900
800
700
1500
1400
1300
1200
1100
1000
900
800
700
700
800
900
700
800
900
700
800
900
Northing (−258000 m)
Rapideye @ 5m
DART @ 2m
DART @ 5m
Fig. 4.9 RGB false-color composite using the RapidEye bands 5 (R), 3 (G), and (2), both for the
simulated image using DART (center panel) and actual RapidEye data acquired over the site (left
panel). The right panel shows a smoothed version of the DART simulation to accommodate for the
lower resolution (5 m) of the RapidEye imaging sensor
4 The Laegeren Site: An Augmented Forest Laboratory