

96
with the latter being potentially as large as the former (e.g., as observed in our leaf
spectra). For details on the definition and computation of richness and other diversityrelated metrics in the scope of this work, please refer to Schneider et al. (2017).
4.5 Results and Discussion
4.5.1 Forward Simulation of Passive Optical Imagery
and Comparison With EO Data
4.5.1.1 Spectral Validation
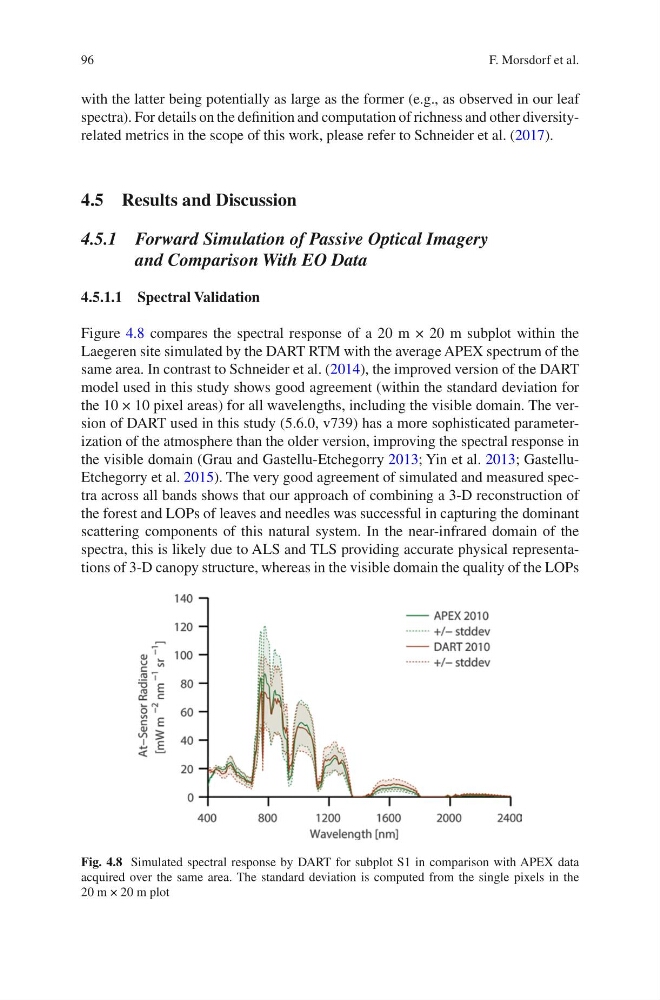
Figure 4.8 compares the spectral response of a 20 m × 20 m subplot within the
Laegeren site simulated by the DART RTM with the average APEX spectrum of the
same area. In contrast to Schneider et al. (2014), the improved version of the DART
model used in this study shows good agreement (within the standard deviation for
the 10 × 10 pixel areas) for all wavelengths, including the visible domain. The version of DART used in this study (5.6.0, v739) has a more sophisticated parameterization of the atmosphere than the older version, improving the spectral response in
the visible domain (Grau and Gastellu-Etchegorry 2013; Yin et al. 2013; GastelluEtchegorry et al. 2015). The very good agreement of simulated and measured spectra across all bands shows that our approach of combining a 3-D reconstruction of
the forest and LOPs of leaves and needles was successful in capturing the dominant
scattering components of this natural system. In the near-infrared domain of the
spectra, this is likely due to ALS and TLS providing accurate physical representations of 3-D canopy structure, whereas in the visible domain the quality of the LOPs
Fig. 4.8 Simulated spectral response by DART for subplot S1 in comparison with APEX data
acquired over the same area. The standard deviation is computed from the single pixels in the
20 m × 20 m plot
F. Morsdorf et al.
with the latter being potentially as large as the former (e.g., as observed in our leaf
spectra). For details on the definition and computation of richness and other diversityrelated metrics in the scope of this work, please refer to Schneider et al. (2017).
4.5 Results and Discussion
4.5.1 Forward Simulation of Passive Optical Imagery
and Comparison With EO Data
4.5.1.1 Spectral Validation
Figure 4.8 compares the spectral response of a 20 m × 20 m subplot within the
Laegeren site simulated by the DART RTM with the average APEX spectrum of the
same area. In contrast to Schneider et al. (2014), the improved version of the DART
model used in this study shows good agreement (within the standard deviation for
the 10 × 10 pixel areas) for all wavelengths, including the visible domain. The version of DART used in this study (5.6.0, v739) has a more sophisticated parameterization of the atmosphere than the older version, improving the spectral response in
the visible domain (Grau and Gastellu-Etchegorry 2013; Yin et al. 2013; GastelluEtchegorry et al. 2015). The very good agreement of simulated and measured spectra across all bands shows that our approach of combining a 3-D reconstruction of
the forest and LOPs of leaves and needles was successful in capturing the dominant
scattering components of this natural system. In the near-infrared domain of the
spectra, this is likely due to ALS and TLS providing accurate physical representations of 3-D canopy structure, whereas in the visible domain the quality of the LOPs
Fig. 4.8 Simulated spectral response by DART for subplot S1 in comparison with APEX data
acquired over the same area. The standard deviation is computed from the single pixels in the
20 m × 20 m plot
F. Morsdorf et al.