

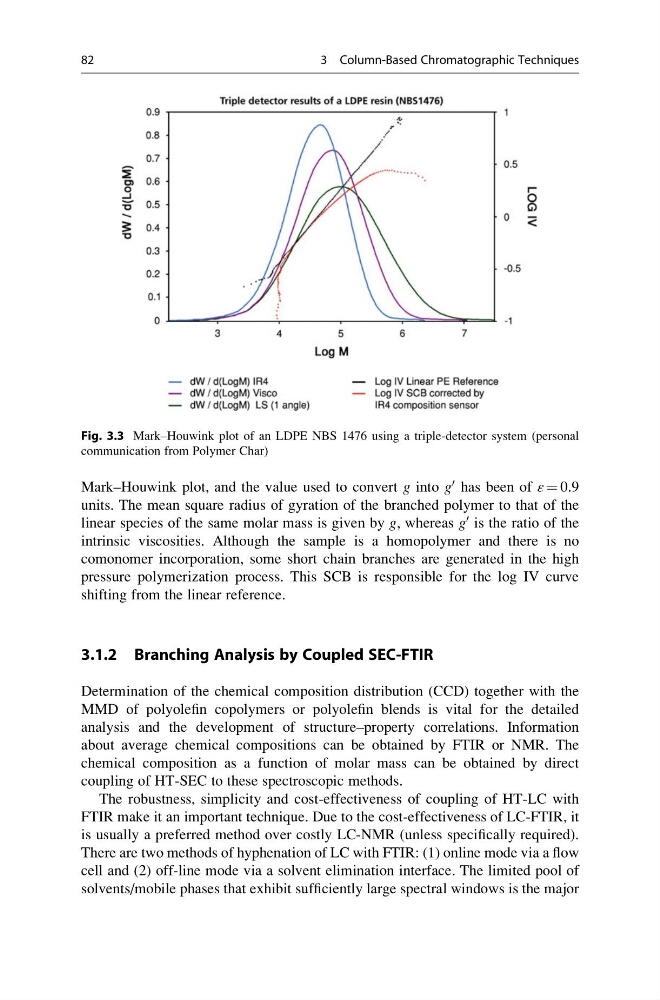
Mark–Houwink plot, and the value used to convert g into g
0 has been of ε ¼ 0.9
units. The mean square radius of gyration of the branched polymer to that of the
linear species of the same molar mass is given by g, whereas g
0 is the ratio of the
intrinsic viscosities. Although the sample is a homopolymer and there is no
comonomer incorporation, some short chain branches are generated in the high
pressure polymerization process. This SCB is responsible for the log IV curve
shifting from the linear reference.
3.1.2 Branching Analysis by Coupled SEC-FTIR
Determination of the chemical composition distribution (CCD) together with the
MMD of polyolefin copolymers or polyolefin blends is vital for the detailed
analysis and the development of structure–property correlations. Information
about average chemical compositions can be obtained by FTIR or NMR. The
chemical composition as a function of molar mass can be obtained by direct
coupling of HT-SEC to these spectroscopic methods.
The robustness, simplicity and cost-effectiveness of coupling of HT-LC with
FTIR make it an important technique. Due to the cost-effectiveness of LC-FTIR, it
is usually a preferred method over costly LC-NMR (unless specifically required).
There are two methods of hyphenation of LC with FTIR: (1) online mode via a flow
cell and (2) off-line mode via a solvent elimination interface. The limited pool of
solvents/mobile phases that exhibit sufficiently large spectral windows is the major
Fig. 3.3 Mark–Houwink plot of an LDPE NBS 1476 using a triple-detector system (personal
communication from Polymer Char)
82
3 Column-Based Chromatographic Techniques
0 has been of ε ¼ 0.9
units. The mean square radius of gyration of the branched polymer to that of the
linear species of the same molar mass is given by g, whereas g
0 is the ratio of the
intrinsic viscosities. Although the sample is a homopolymer and there is no
comonomer incorporation, some short chain branches are generated in the high
pressure polymerization process. This SCB is responsible for the log IV curve
shifting from the linear reference.
3.1.2 Branching Analysis by Coupled SEC-FTIR
Determination of the chemical composition distribution (CCD) together with the
MMD of polyolefin copolymers or polyolefin blends is vital for the detailed
analysis and the development of structure–property correlations. Information
about average chemical compositions can be obtained by FTIR or NMR. The
chemical composition as a function of molar mass can be obtained by direct
coupling of HT-SEC to these spectroscopic methods.
The robustness, simplicity and cost-effectiveness of coupling of HT-LC with
FTIR make it an important technique. Due to the cost-effectiveness of LC-FTIR, it
is usually a preferred method over costly LC-NMR (unless specifically required).
There are two methods of hyphenation of LC with FTIR: (1) online mode via a flow
cell and (2) off-line mode via a solvent elimination interface. The limited pool of
solvents/mobile phases that exhibit sufficiently large spectral windows is the major
Fig. 3.3 Mark–Houwink plot of an LDPE NBS 1476 using a triple-detector system (personal
communication from Polymer Char)
82
3 Column-Based Chromatographic Techniques