

When the viscometer was used for molar mass calculation then a universal
calibration curve based on the PS standards was used. For the analysis of the LS
measurements, the RI increment was determined using a differential refractometer.
For the sample under investigation, dn/dc was 0.104. A scattering angle of 90
was
used for the molar mass analysis.
3.1.1.5 Measurement and Evaluation
The LDPE sample was dissolved in the mobile phase and injected into the SEC
system. Elution of the sample components was monitored with the IR, Visco and
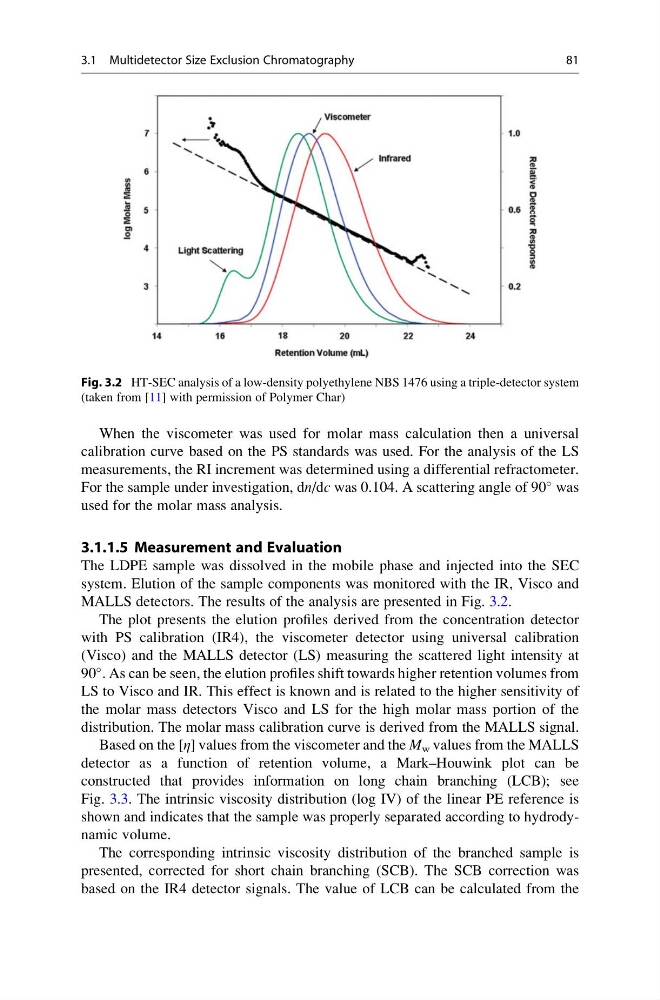
MALLS detectors. The results of the analysis are presented in Fig. 3.2.
The plot presents the elution profiles derived from the concentration detector
with PS calibration (IR4), the viscometer detector using universal calibration
(Visco) and the MALLS detector (LS) measuring the scattered light intensity at
90
. As can be seen, the elution profiles shift towards higher retention volumes from
LS to Visco and IR. This effect is known and is related to the higher sensitivity of
the molar mass detectors Visco and LS for the high molar mass portion of the
distribution. The molar mass calibration curve is derived from the MALLS signal.
Based on the [η] values from the viscometer and the M w values from the MALLS
detector as a function of retention volume, a Mark–Houwink plot can be
constructed that provides information on long chain branching (LCB); see
Fig. 3.3. The intrinsic viscosity distribution (log IV) of the linear PE reference is
shown and indicates that the sample was properly separated according to hydrodynamic volume.
The corresponding intrinsic viscosity distribution of the branched sample is
presented, corrected for short chain branching (SCB). The SCB correction was
based on the IR4 detector signals. The value of LCB can be calculated from the
Fig. 3.2 HT-SEC analysis of a low-density polyethylene NBS 1476 using a triple-detector system
(taken from [11] with permission of Polymer Char)
3.1 Multidetector Size Exclusion Chromatography
81
calibration curve based on the PS standards was used. For the analysis of the LS
measurements, the RI increment was determined using a differential refractometer.
For the sample under investigation, dn/dc was 0.104. A scattering angle of 90
was
used for the molar mass analysis.
3.1.1.5 Measurement and Evaluation
The LDPE sample was dissolved in the mobile phase and injected into the SEC
system. Elution of the sample components was monitored with the IR, Visco and
MALLS detectors. The results of the analysis are presented in Fig. 3.2.
The plot presents the elution profiles derived from the concentration detector
with PS calibration (IR4), the viscometer detector using universal calibration
(Visco) and the MALLS detector (LS) measuring the scattered light intensity at
90
. As can be seen, the elution profiles shift towards higher retention volumes from
LS to Visco and IR. This effect is known and is related to the higher sensitivity of
the molar mass detectors Visco and LS for the high molar mass portion of the
distribution. The molar mass calibration curve is derived from the MALLS signal.
Based on the [η] values from the viscometer and the M w values from the MALLS
detector as a function of retention volume, a Mark–Houwink plot can be
constructed that provides information on long chain branching (LCB); see
Fig. 3.3. The intrinsic viscosity distribution (log IV) of the linear PE reference is
shown and indicates that the sample was properly separated according to hydrodynamic volume.
The corresponding intrinsic viscosity distribution of the branched sample is
presented, corrected for short chain branching (SCB). The SCB correction was
based on the IR4 detector signals. The value of LCB can be calculated from the
Fig. 3.2 HT-SEC analysis of a low-density polyethylene NBS 1476 using a triple-detector system
(taken from [11] with permission of Polymer Char)
3.1 Multidetector Size Exclusion Chromatography
81