

blend composition as calculated by CRYSTAF agrees quite well with the nominal
composition of the samples over the entire range of compositions.
2.2.2.6 Discussion and Evaluation
ZN-catalysed polyolefins and their blends still dominate industrial applications.
DSC is not capable of analysing different blends of HDPE and LDPE because the
melting temperatures of both components are quite similar and the DSC peaks are
rather broad. The CRYSTAF analysis revealed excellent separation of blends with
varying compositions of HDPE (Lupolen 5261Z) and LDPE (Lupolen 1800H), as
can be seen in Fig. 2.35. The sharp crystalline peak for HDPE appeared at 88.0
C
and a small fraction of less than 5 % crystallized at lower temperature suggesting
small amounts of less crystalline PE. At an even lower temperature of 59.1
C, a
broad crystallization peak for LLDPE is obtained.
The CRYSTAF analysis revealed well separated crystallization peaks for blends
of HDPE and LDPE that can be quantified easily in the composition range of
HDPE/LDPE 90/10 to 10/90. The lower detection limit for HDPE is less than
4 wt% in this case. The detection limit for LDPE is higher because HDPE itself
contains some less crystalline material. The lower detection limit for LDPE in the
present case is 10 wt%. Figure 2.36 demonstrates the comparison of CRYSTAF
results with the nominal composition of the sample. Excellent agreement is found
over the entire range of compositions.
An increasingly important topic is the characterization of waste plastics or
materials resulting from recycling processes. Recycled plastics frequently contain
several diverse components and these must be analysed with regard to their PP,
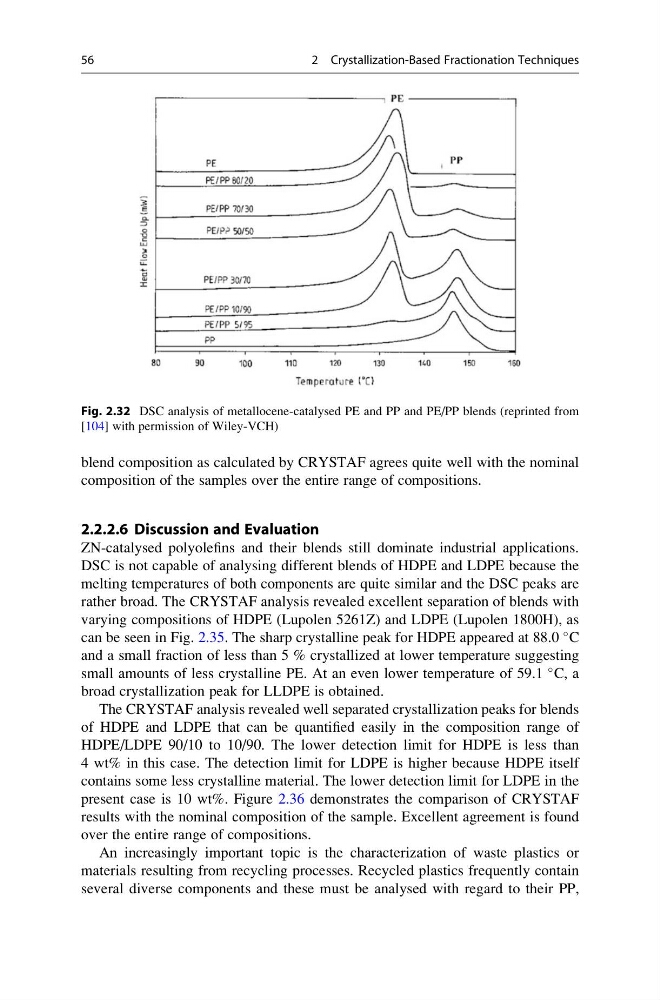
Fig. 2.32 DSC analysis of metallocene-catalysed PE and PP and PE/PP blends (reprinted from
[104] with permission of Wiley-VCH)
56
2 Crystallization-Based Fractionation Techniques
composition of the samples over the entire range of compositions.
2.2.2.6 Discussion and Evaluation
ZN-catalysed polyolefins and their blends still dominate industrial applications.
DSC is not capable of analysing different blends of HDPE and LDPE because the
melting temperatures of both components are quite similar and the DSC peaks are
rather broad. The CRYSTAF analysis revealed excellent separation of blends with
varying compositions of HDPE (Lupolen 5261Z) and LDPE (Lupolen 1800H), as
can be seen in Fig. 2.35. The sharp crystalline peak for HDPE appeared at 88.0
C
and a small fraction of less than 5 % crystallized at lower temperature suggesting
small amounts of less crystalline PE. At an even lower temperature of 59.1
C, a
broad crystallization peak for LLDPE is obtained.
The CRYSTAF analysis revealed well separated crystallization peaks for blends
of HDPE and LDPE that can be quantified easily in the composition range of
HDPE/LDPE 90/10 to 10/90. The lower detection limit for HDPE is less than
4 wt% in this case. The detection limit for LDPE is higher because HDPE itself
contains some less crystalline material. The lower detection limit for LDPE in the
present case is 10 wt%. Figure 2.36 demonstrates the comparison of CRYSTAF
results with the nominal composition of the sample. Excellent agreement is found
over the entire range of compositions.
An increasingly important topic is the characterization of waste plastics or
materials resulting from recycling processes. Recycled plastics frequently contain
several diverse components and these must be analysed with regard to their PP,
Fig. 2.32 DSC analysis of metallocene-catalysed PE and PP and PE/PP blends (reprinted from
[104] with permission of Wiley-VCH)
56
2 Crystallization-Based Fractionation Techniques