

amounts of PP, it is difficult to detect the PP peak in a routine experiment. The melt
enthalpy is a function of crystallinity and thermal history of the sample; therefore,
quantitative information on blend composition is rather difficult to obtain, unless
further information on the samples is obtained by additional measurements.
2.2.2.5 CRYSTAF Fractionations
The CRYSTAF results of a variety of PE/PP blends are presented in Fig. 2.33. The
crystallization temperatures of the blend components are clearly different. PE
crystallizes at higher temperature (86.3
C) compared to PP (70.5
C). Narrow
and well resolved crystallization peaks are obtained for both PE and PP. A true
concentration profile is obtained directly, unlike with DSC. Therefore, the relative
concentrations of the components can be calculated directly from the experimental
results without further assumptions.
In contrast to DSC, very low concentrations of the blend components can be
detected, as seen in Fig. 2.33. The detection limits for both components are very low
(5 wt% for PP and 2–3 wt% for PE). As can be seen in Fig. 2.34, the experimental
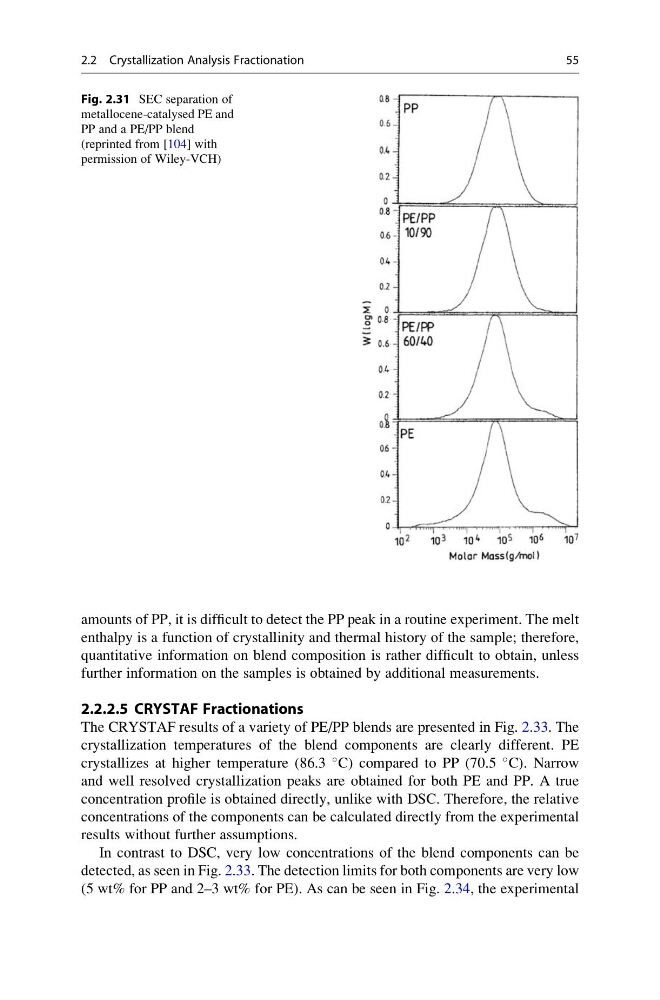
Fig. 2.31 SEC separation of
metallocene-catalysed PE and
PP and a PE/PP blend
(reprinted from [104] with
permission of Wiley-VCH)
2.2 Crystallization Analysis Fractionation
55
enthalpy is a function of crystallinity and thermal history of the sample; therefore,
quantitative information on blend composition is rather difficult to obtain, unless
further information on the samples is obtained by additional measurements.
2.2.2.5 CRYSTAF Fractionations
The CRYSTAF results of a variety of PE/PP blends are presented in Fig. 2.33. The
crystallization temperatures of the blend components are clearly different. PE
crystallizes at higher temperature (86.3
C) compared to PP (70.5
C). Narrow
and well resolved crystallization peaks are obtained for both PE and PP. A true
concentration profile is obtained directly, unlike with DSC. Therefore, the relative
concentrations of the components can be calculated directly from the experimental
results without further assumptions.
In contrast to DSC, very low concentrations of the blend components can be
detected, as seen in Fig. 2.33. The detection limits for both components are very low
(5 wt% for PP and 2–3 wt% for PE). As can be seen in Fig. 2.34, the experimental
Fig. 2.31 SEC separation of
metallocene-catalysed PE and
PP and a PE/PP blend
(reprinted from [104] with
permission of Wiley-VCH)
2.2 Crystallization Analysis Fractionation
55