

and DSC agreed quite well. The 30
C and 90
C fractions of samples 3V and 4V
show slight differences in their molar masses. The fractions collected at similar
TREF elution temperatures for both products have almost identical T m and T c
values. The similarity in distribution of isotacticity of the PP phase and the
sequence length of ethylene and propylene of the EPC component of corresponding
fractions of the two copolymers is illustrated by the results. However, weight
percentages of the fractions eluting at corresponding elution temperatures are
different for the two samples. For copolymer 4V, larger amounts of amorphous
fractions (30–90
C) and smaller amounts of more crystalline fractions (110
C and
120
C) are collected during P-TREF compared to product 3V. Similar amounts
0.1 0.2 0.3
0.4
0.5
0.6
0.7
0.8
76
78
80
82
84
0
100000
200000
300000
400000
3V
4V
CRY
STAF
T c
(ºC)
M o le c u la r w e ig h t ( g . m o l
-1 )
C a rb o n y l in d e x
0.1 0.2 0.3
0.4
0.5
0.6
0.7
0.8
148
152
156
160
164
0
100000
200000
300000
400000
3V
4V
DSC
T m
M o le c u la r w e ig h t ( g . m o l
-1 )
C a rb o n y l in d e x
a
b
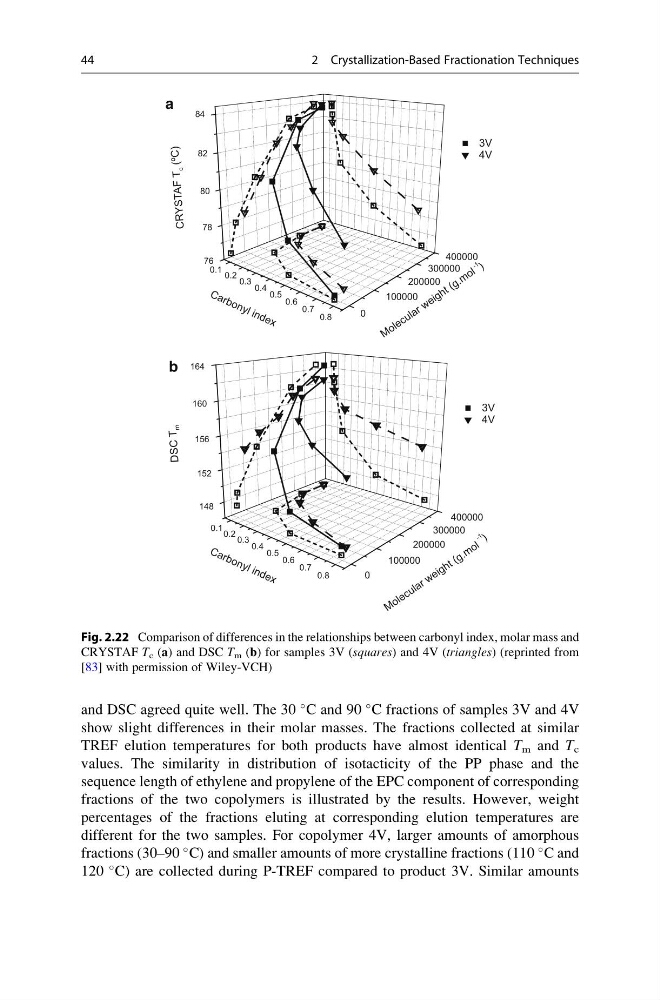
Fig. 2.22 Comparison of differences in the relationships between carbonyl index, molar mass and
CRYSTAF T c (a) and DSC T m (b) for samples 3V (squares) and 4V (triangles) (reprinted from
[83] with permission of Wiley-VCH)
44
2 Crystallization-Based Fractionation Techniques
C and 90
C fractions of samples 3V and 4V
show slight differences in their molar masses. The fractions collected at similar
TREF elution temperatures for both products have almost identical T m and T c
values. The similarity in distribution of isotacticity of the PP phase and the
sequence length of ethylene and propylene of the EPC component of corresponding
fractions of the two copolymers is illustrated by the results. However, weight
percentages of the fractions eluting at corresponding elution temperatures are
different for the two samples. For copolymer 4V, larger amounts of amorphous
fractions (30–90
C) and smaller amounts of more crystalline fractions (110
C and
120
C) are collected during P-TREF compared to product 3V. Similar amounts
0.1 0.2 0.3
0.4
0.5
0.6
0.7
0.8
76
78
80
82
84
0
100000
200000
300000
400000
3V
4V
CRY
STAF
T c
(ºC)
M o le c u la r w e ig h t ( g . m o l
-1 )
C a rb o n y l in d e x
0.1 0.2 0.3
0.4
0.5
0.6
0.7
0.8
148
152
156
160
164
0
100000
200000
300000
400000
3V
4V
DSC
T m
M o le c u la r w e ig h t ( g . m o l
-1 )
C a rb o n y l in d e x
a
b
Fig. 2.22 Comparison of differences in the relationships between carbonyl index, molar mass and
CRYSTAF T c (a) and DSC T m (b) for samples 3V (squares) and 4V (triangles) (reprinted from
[83] with permission of Wiley-VCH)
44
2 Crystallization-Based Fractionation Techniques