

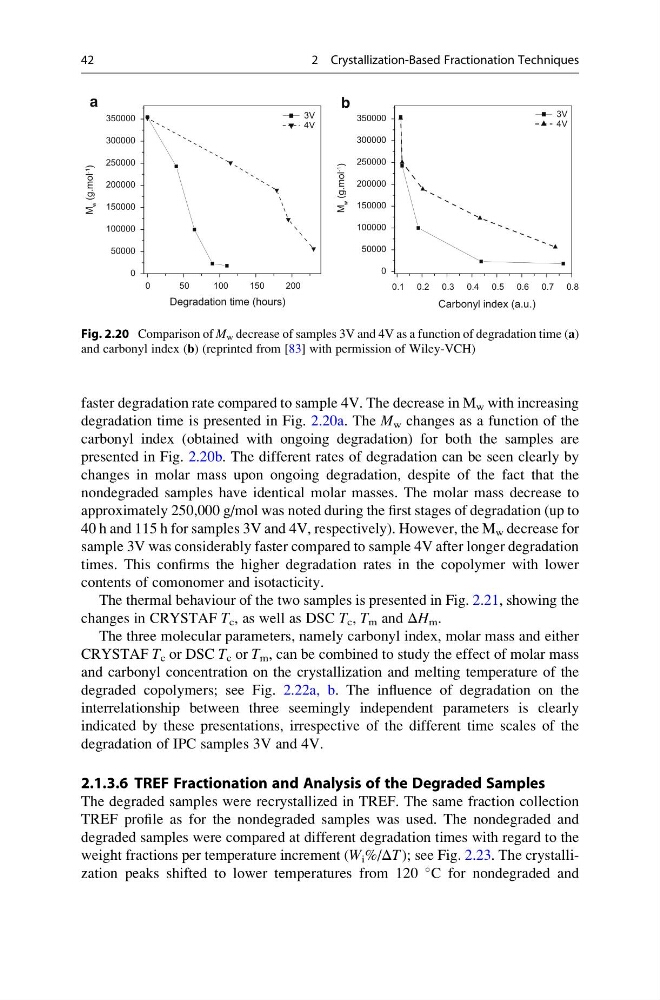
faster degradation rate compared to sample 4V. The decrease in M w with increasing
degradation time is presented in Fig. 2.20a. The M w changes as a function of the
carbonyl index (obtained with ongoing degradation) for both the samples are
presented in Fig. 2.20b. The different rates of degradation can be seen clearly by
changes in molar mass upon ongoing degradation, despite of the fact that the
nondegraded samples have identical molar masses. The molar mass decrease to
approximately 250,000 g/mol was noted during the first stages of degradation (up to
40 h and 115 h for samples 3V and 4V, respectively). However, the M w decrease for
sample 3V was considerably faster compared to sample 4V after longer degradation
times. This confirms the higher degradation rates in the copolymer with lower
contents of comonomer and isotacticity.
The thermal behaviour of the two samples is presented in Fig. 2.21, showing the
changes in CRYSTAF T c , as well as DSC T c , T m and ΔH m .
The three molecular parameters, namely carbonyl index, molar mass and either
CRYSTAF T c or DSC T c or T m , can be combined to study the effect of molar mass
and carbonyl concentration on the crystallization and melting temperature of the
degraded copolymers; see Fig. 2.22a, b. The influence of degradation on the
interrelationship between three seemingly independent parameters is clearly
indicated by these presentations, irrespective of the different time scales of the
degradation of IPC samples 3V and 4V.
2.1.3.6 TREF Fractionation and Analysis of the Degraded Samples
The degraded samples were recrystallized in TREF. The same fraction collection
TREF profile as for the nondegraded samples was used. The nondegraded and
degraded samples were compared at different degradation times with regard to the
weight fractions per temperature increment (W i %/ΔT); see Fig. 2.23. The crystallization peaks shifted to lower temperatures from 120
C for nondegraded and
0
50
100
150
200
0
50000
100000
150000
200000
250000
300000
350000
3V
4V
M
w
(g.mol -1
)
Degradation time (hours)
a
0.1 0.2 0.3 0.4 0.5 0.6 0.7 0.8
0
50000
100000
150000
200000
250000
300000
350000
b
M
w
(g.mol -1
)
3V
4V
Carbonyl index (a.u.)
Fig. 2.20 Comparison of M w decrease of samples 3V and 4V as a function of degradation time (a)
and carbonyl index (b) (reprinted from [83] with permission of Wiley-VCH)
42
2 Crystallization-Based Fractionation Techniques
degradation time is presented in Fig. 2.20a. The M w changes as a function of the
carbonyl index (obtained with ongoing degradation) for both the samples are
presented in Fig. 2.20b. The different rates of degradation can be seen clearly by
changes in molar mass upon ongoing degradation, despite of the fact that the
nondegraded samples have identical molar masses. The molar mass decrease to
approximately 250,000 g/mol was noted during the first stages of degradation (up to
40 h and 115 h for samples 3V and 4V, respectively). However, the M w decrease for
sample 3V was considerably faster compared to sample 4V after longer degradation
times. This confirms the higher degradation rates in the copolymer with lower
contents of comonomer and isotacticity.
The thermal behaviour of the two samples is presented in Fig. 2.21, showing the
changes in CRYSTAF T c , as well as DSC T c , T m and ΔH m .
The three molecular parameters, namely carbonyl index, molar mass and either
CRYSTAF T c or DSC T c or T m , can be combined to study the effect of molar mass
and carbonyl concentration on the crystallization and melting temperature of the
degraded copolymers; see Fig. 2.22a, b. The influence of degradation on the
interrelationship between three seemingly independent parameters is clearly
indicated by these presentations, irrespective of the different time scales of the
degradation of IPC samples 3V and 4V.
2.1.3.6 TREF Fractionation and Analysis of the Degraded Samples
The degraded samples were recrystallized in TREF. The same fraction collection
TREF profile as for the nondegraded samples was used. The nondegraded and
degraded samples were compared at different degradation times with regard to the
weight fractions per temperature increment (W i %/ΔT); see Fig. 2.23. The crystallization peaks shifted to lower temperatures from 120
C for nondegraded and
0
50
100
150
200
0
50000
100000
150000
200000
250000
300000
350000
3V
4V
M
w
(g.mol -1
)
Degradation time (hours)
a
0.1 0.2 0.3 0.4 0.5 0.6 0.7 0.8
0
50000
100000
150000
200000
250000
300000
350000
b
M
w
(g.mol -1
)
3V
4V
Carbonyl index (a.u.)
Fig. 2.20 Comparison of M w decrease of samples 3V and 4V as a function of degradation time (a)
and carbonyl index (b) (reprinted from [83] with permission of Wiley-VCH)
42
2 Crystallization-Based Fractionation Techniques