

sequences. iPP is the major constituent of the 110–130
C fractions, with traces of
PE homopolymer.
2.1.3.5 Analysis of Degraded Bulk Samples
The accelerated thermo-oxidative degradation of thin films of samples 3V and 4V
was executed under similar conditions. After predetermined times, samples of both
grades were taken from the oven and analysed further. FTIR data and the progress
of embrittlement of complete film areas were used for monitoring the progress of
degradation. The differences in the embrittlement rate of both samples were
compared. The 3V films showed faster embrittlement compared to sample 4V.
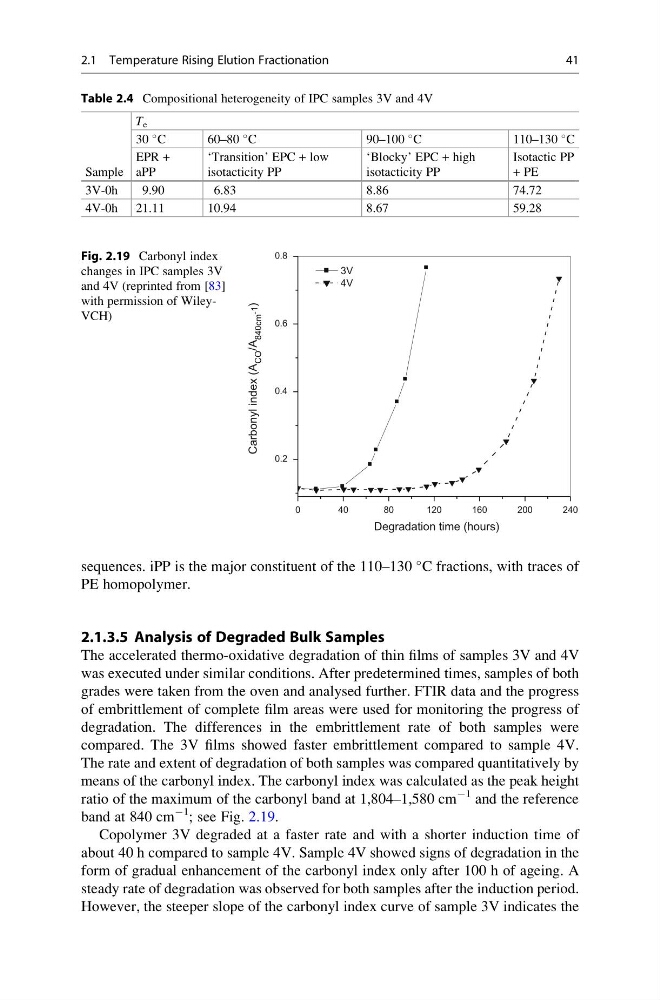
The rate and extent of degradation of both samples was compared quantitatively by
means of the carbonyl index. The carbonyl index was calculated as the peak height
ratio of the maximum of the carbonyl band at 1,804–1,580 cm
À1 and the reference
band at 840 cm
À1 ; see Fig. 2.19.
Copolymer 3V degraded at a faster rate and with a shorter induction time of
about 40 h compared to sample 4V. Sample 4V showed signs of degradation in the
form of gradual enhancement of the carbonyl index only after 100 h of ageing. A
steady rate of degradation was observed for both samples after the induction period.
However, the steeper slope of the carbonyl index curve of sample 3V indicates the
Table 2.4 Compositional heterogeneity of IPC samples 3V and 4V
Sample
T e
30
C
60–80
C
90–100
C
110–130
C
EPR +
aPP
‘Transition’ EPC + low
isotacticity PP
‘Blocky’ EPC + high
isotacticity PP
Isotactic PP
+ PE
3V-0h
9.90
6.83
8.86
74.72
4V-0h 21.11
10.94
8.67
59.28
0
40
80
120
160
200
240
0.2
0.4
0.6
0.8
3V
4V
Carbonyl index (A
CO
/A
840cm -1)
Degradation time (hours)
Fig. 2.19 Carbonyl index
changes in IPC samples 3V
and 4V (reprinted from [83]
with permission of WileyVCH)
2.1 Temperature Rising Elution Fractionation
41
C fractions, with traces of
PE homopolymer.
2.1.3.5 Analysis of Degraded Bulk Samples
The accelerated thermo-oxidative degradation of thin films of samples 3V and 4V
was executed under similar conditions. After predetermined times, samples of both
grades were taken from the oven and analysed further. FTIR data and the progress
of embrittlement of complete film areas were used for monitoring the progress of
degradation. The differences in the embrittlement rate of both samples were
compared. The 3V films showed faster embrittlement compared to sample 4V.
The rate and extent of degradation of both samples was compared quantitatively by
means of the carbonyl index. The carbonyl index was calculated as the peak height
ratio of the maximum of the carbonyl band at 1,804–1,580 cm
À1 and the reference
band at 840 cm
À1 ; see Fig. 2.19.
Copolymer 3V degraded at a faster rate and with a shorter induction time of
about 40 h compared to sample 4V. Sample 4V showed signs of degradation in the
form of gradual enhancement of the carbonyl index only after 100 h of ageing. A
steady rate of degradation was observed for both samples after the induction period.
However, the steeper slope of the carbonyl index curve of sample 3V indicates the
Table 2.4 Compositional heterogeneity of IPC samples 3V and 4V
Sample
T e
30
C
60–80
C
90–100
C
110–130
C
EPR +
aPP
‘Transition’ EPC + low
isotacticity PP
‘Blocky’ EPC + high
isotacticity PP
Isotactic PP
+ PE
3V-0h
9.90
6.83
8.86
74.72
4V-0h 21.11
10.94
8.67
59.28
0
40
80
120
160
200
240
0.2
0.4
0.6
0.8
3V
4V
Carbonyl index (A
CO
/A
840cm -1)
Degradation time (hours)
Fig. 2.19 Carbonyl index
changes in IPC samples 3V
and 4V (reprinted from [83]
with permission of WileyVCH)
2.1 Temperature Rising Elution Fractionation
41