

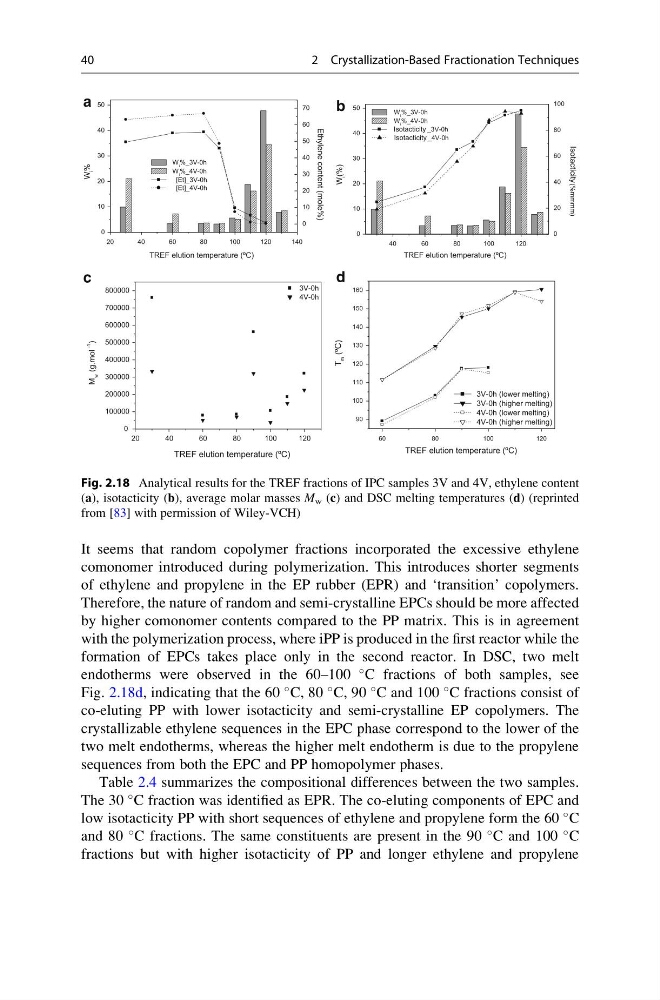
It seems that random copolymer fractions incorporated the excessive ethylene
comonomer introduced during polymerization. This introduces shorter segments
of ethylene and propylene in the EP rubber (EPR) and ‘transition’ copolymers.
Therefore, the nature of random and semi-crystalline EPCs should be more affected
by higher comonomer contents compared to the PP matrix. This is in agreement
with the polymerization process, where iPP is produced in the first reactor while the
formation of EPCs takes place only in the second reactor. In DSC, two melt
endotherms were observed in the 60–100
C fractions of both samples, see
Fig. 2.18d, indicating that the 60
C, 80
C, 90
C and 100
C fractions consist of
co-eluting PP with lower isotacticity and semi-crystalline EP copolymers. The
crystallizable ethylene sequences in the EPC phase correspond to the lower of the
two melt endotherms, whereas the higher melt endotherm is due to the propylene
sequences from both the EPC and PP homopolymer phases.
Table 2.4 summarizes the compositional differences between the two samples.
The 30
C fraction was identified as EPR. The co-eluting components of EPC and
low isotacticity PP with short sequences of ethylene and propylene form the 60
C
and 80
C fractions. The same constituents are present in the 90
C and 100
C
fractions but with higher isotacticity of PP and longer ethylene and propylene
0
10
20
30
40
50
60
70
20
40
60
80
100
120
140
0
10
20
30
40
50
W
i
%
TREF elution temperature (ºC)
W i %_3V-0h
W i %_4V-0h
[Et]_3V-0h
[Et]_4V-0h
Ethylene content (mole%)
0
20
40
60
80
100
40
60
80
100
120
0
10
20
30
40
50
Isotacticity (%mmmm)
W i %_3V-0h
W i %_4V-0h
Isotacticity _3V-0h
Isotacticity _4V-0h
W
i
(%)
TREF elution temperature (ºC)
20
40
60
80
100
120
0
100000
200000
300000
400000
500000
600000
700000
800000
3V-0h
4V-0h
M
w
(g.mol
-1
)
TREF elution temperature (ºC)
60
80
100
120
90
100
110
120
130
140
150
160
3V-0h (lower melting)
3V-0h (higher melting)
4V-0h (lower melting)
4V-0h (higher melting)
T
m
(ºC)
TREF elution temperature (ºC)
a
b
c
d
Fig. 2.18 Analytical results for the TREF fractions of IPC samples 3V and 4V, ethylene content
(a), isotacticity (b), average molar masses M w (c) and DSC melting temperatures (d) (reprinted
from [83] with permission of Wiley-VCH)
40
2 Crystallization-Based Fractionation Techniques
comonomer introduced during polymerization. This introduces shorter segments
of ethylene and propylene in the EP rubber (EPR) and ‘transition’ copolymers.
Therefore, the nature of random and semi-crystalline EPCs should be more affected
by higher comonomer contents compared to the PP matrix. This is in agreement
with the polymerization process, where iPP is produced in the first reactor while the
formation of EPCs takes place only in the second reactor. In DSC, two melt
endotherms were observed in the 60–100
C fractions of both samples, see
Fig. 2.18d, indicating that the 60
C, 80
C, 90
C and 100
C fractions consist of
co-eluting PP with lower isotacticity and semi-crystalline EP copolymers. The
crystallizable ethylene sequences in the EPC phase correspond to the lower of the
two melt endotherms, whereas the higher melt endotherm is due to the propylene
sequences from both the EPC and PP homopolymer phases.
Table 2.4 summarizes the compositional differences between the two samples.
The 30
C fraction was identified as EPR. The co-eluting components of EPC and
low isotacticity PP with short sequences of ethylene and propylene form the 60
C
and 80
C fractions. The same constituents are present in the 90
C and 100
C
fractions but with higher isotacticity of PP and longer ethylene and propylene
0
10
20
30
40
50
60
70
20
40
60
80
100
120
140
0
10
20
30
40
50
W
i
%
TREF elution temperature (ºC)
W i %_3V-0h
W i %_4V-0h
[Et]_3V-0h
[Et]_4V-0h
Ethylene content (mole%)
0
20
40
60
80
100
40
60
80
100
120
0
10
20
30
40
50
Isotacticity (%mmmm)
W i %_3V-0h
W i %_4V-0h
Isotacticity _3V-0h
Isotacticity _4V-0h
W
i
(%)
TREF elution temperature (ºC)
20
40
60
80
100
120
0
100000
200000
300000
400000
500000
600000
700000
800000
3V-0h
4V-0h
M
w
(g.mol
-1
)
TREF elution temperature (ºC)
60
80
100
120
90
100
110
120
130
140
150
160
3V-0h (lower melting)
3V-0h (higher melting)
4V-0h (lower melting)
4V-0h (higher melting)
T
m
(ºC)
TREF elution temperature (ºC)
a
b
c
d
Fig. 2.18 Analytical results for the TREF fractions of IPC samples 3V and 4V, ethylene content
(a), isotacticity (b), average molar masses M w (c) and DSC melting temperatures (d) (reprinted
from [83] with permission of Wiley-VCH)
40
2 Crystallization-Based Fractionation Techniques