

followed by cooling to 100
C for stabilization and then to 30
C at a cooling rate
of 0.1
C/min. Fractions were collected automatically and an IR detector was
used to determine the concentration of the solution at the chosen wavelength of
3.5 μm.
2.1.3.4 TREF Fractionation and Analysis of Non-degraded Samples
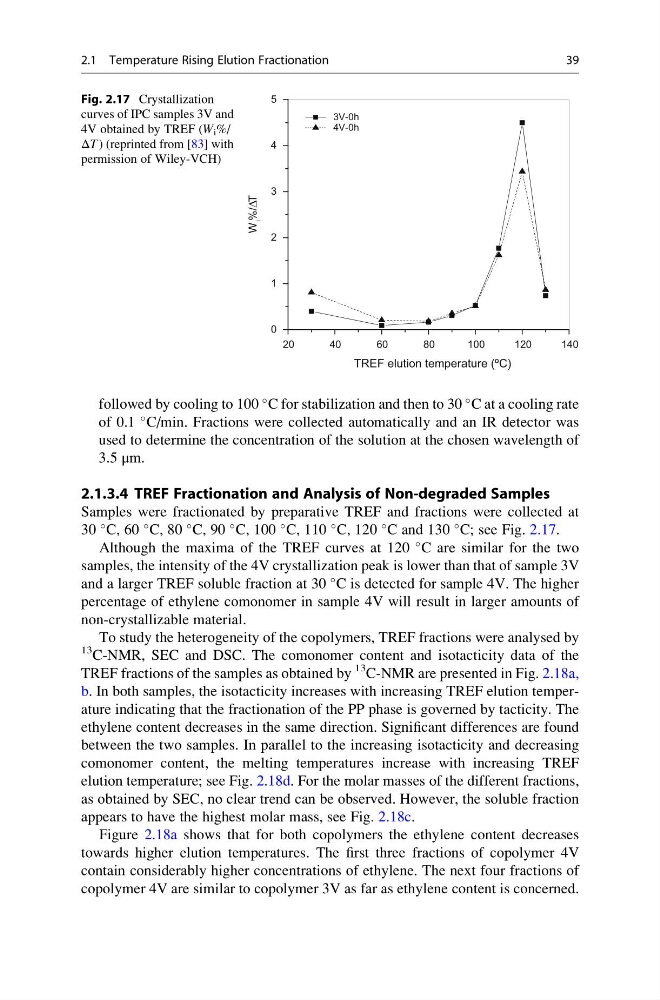
Samples were fractionated by preparative TREF and fractions were collected at
30
C, 60
C, 80
C, 90
C, 100
C, 110
C, 120
C and 130
C; see Fig. 2.17.
Although the maxima of the TREF curves at 120
C are similar for the two
samples, the intensity of the 4V crystallization peak is lower than that of sample 3V
and a larger TREF soluble fraction at 30
C is detected for sample 4V. The higher
percentage of ethylene comonomer in sample 4V will result in larger amounts of
non-crystallizable material.
To study the heterogeneity of the copolymers, TREF fractions were analysed by
13 C-NMR, SEC and DSC. The comonomer content and isotacticity data of the
TREF fractions of the samples as obtained by
13
C-NMR are presented in Fig. 2.18a,
b. In both samples, the isotacticity increases with increasing TREF elution temperature indicating that the fractionation of the PP phase is governed by tacticity. The
ethylene content decreases in the same direction. Significant differences are found
between the two samples. In parallel to the increasing isotacticity and decreasing
comonomer content, the melting temperatures increase with increasing TREF
elution temperature; see Fig. 2.18d. For the molar masses of the different fractions,
as obtained by SEC, no clear trend can be observed. However, the soluble fraction
appears to have the highest molar mass, see Fig. 2.18c.
Figure 2.18a shows that for both copolymers the ethylene content decreases
towards higher elution temperatures. The first three fractions of copolymer 4V
contain considerably higher concentrations of ethylene. The next four fractions of
copolymer 4V are similar to copolymer 3V as far as ethylene content is concerned.
20
40
60
80
100
120
140
0
1
2
3
4
5
3V-0h
4V-0h
W
i
%/DT
TREF elution temperature (ºC)
Fig. 2.17 Crystallization
curves of IPC samples 3V and
4V obtained by TREF (W i %/
ΔT ) (reprinted from [83] with
permission of Wiley-VCH)
2.1 Temperature Rising Elution Fractionation
39
C for stabilization and then to 30
C at a cooling rate
of 0.1
C/min. Fractions were collected automatically and an IR detector was
used to determine the concentration of the solution at the chosen wavelength of
3.5 μm.
2.1.3.4 TREF Fractionation and Analysis of Non-degraded Samples
Samples were fractionated by preparative TREF and fractions were collected at
30
C, 60
C, 80
C, 90
C, 100
C, 110
C, 120
C and 130
C; see Fig. 2.17.
Although the maxima of the TREF curves at 120
C are similar for the two
samples, the intensity of the 4V crystallization peak is lower than that of sample 3V
and a larger TREF soluble fraction at 30
C is detected for sample 4V. The higher
percentage of ethylene comonomer in sample 4V will result in larger amounts of
non-crystallizable material.
To study the heterogeneity of the copolymers, TREF fractions were analysed by
13 C-NMR, SEC and DSC. The comonomer content and isotacticity data of the
TREF fractions of the samples as obtained by
13
C-NMR are presented in Fig. 2.18a,
b. In both samples, the isotacticity increases with increasing TREF elution temperature indicating that the fractionation of the PP phase is governed by tacticity. The
ethylene content decreases in the same direction. Significant differences are found
between the two samples. In parallel to the increasing isotacticity and decreasing
comonomer content, the melting temperatures increase with increasing TREF
elution temperature; see Fig. 2.18d. For the molar masses of the different fractions,
as obtained by SEC, no clear trend can be observed. However, the soluble fraction
appears to have the highest molar mass, see Fig. 2.18c.
Figure 2.18a shows that for both copolymers the ethylene content decreases
towards higher elution temperatures. The first three fractions of copolymer 4V
contain considerably higher concentrations of ethylene. The next four fractions of
copolymer 4V are similar to copolymer 3V as far as ethylene content is concerned.
20
40
60
80
100
120
140
0
1
2
3
4
5
3V-0h
4V-0h
W
i
%/DT
TREF elution temperature (ºC)
Fig. 2.17 Crystallization
curves of IPC samples 3V and
4V obtained by TREF (W i %/
ΔT ) (reprinted from [83] with
permission of Wiley-VCH)
2.1 Temperature Rising Elution Fractionation
39