

approach is that not only can two wavelengths (e.g. for total concentration and
methyl group content) be monitored, but for each SEC slice a complete FTIR
spectrum is generated. The results of the SEC-FTIR analysis of the TREF fractions
are summarized in Figs. 2.15 and 2.16.
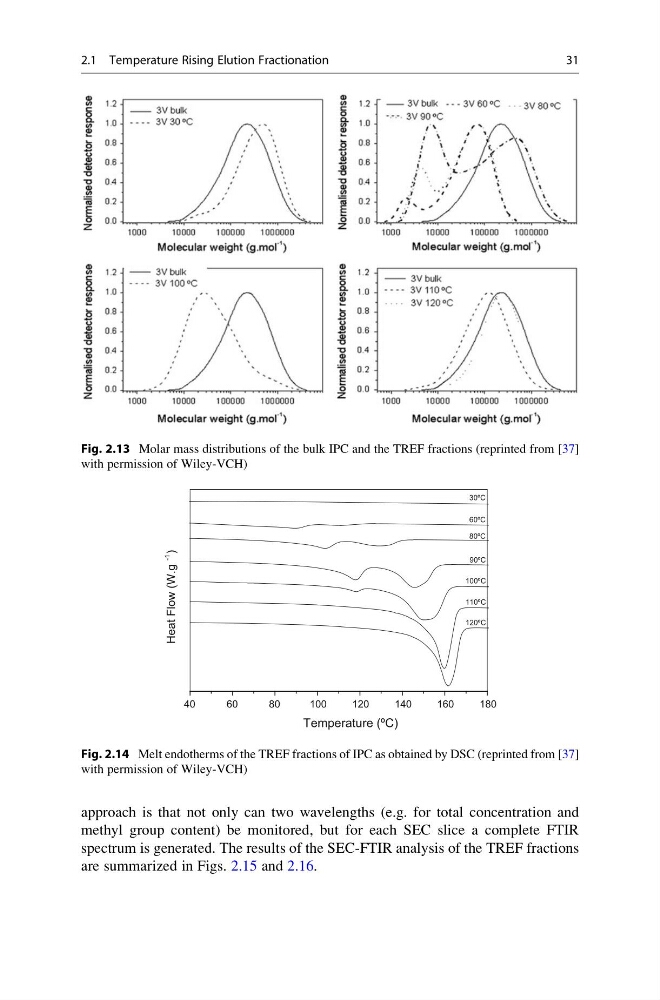
Fig. 2.13 Molar mass distributions of the bulk IPC and the TREF fractions (reprinted from [37]
with permission of Wiley-VCH)
40
60
80
100
120
140
160
180
120ºC
110ºC
100ºC
90ºC
80ºC
60ºC
30ºC
Heat Flow (W.g
-1
)
Temperature (ºC)
Fig. 2.14 Melt endotherms of the TREF fractions of IPC as obtained by DSC (reprinted from [37]
with permission of Wiley-VCH)
2.1 Temperature Rising Elution Fractionation
31
methyl group content) be monitored, but for each SEC slice a complete FTIR
spectrum is generated. The results of the SEC-FTIR analysis of the TREF fractions
are summarized in Figs. 2.15 and 2.16.
Fig. 2.13 Molar mass distributions of the bulk IPC and the TREF fractions (reprinted from [37]
with permission of Wiley-VCH)
40
60
80
100
120
140
160
180
120ºC
110ºC
100ºC
90ºC
80ºC
60ºC
30ºC
Heat Flow (W.g
-1
)
Temperature (ºC)
Fig. 2.14 Melt endotherms of the TREF fractions of IPC as obtained by DSC (reprinted from [37]
with permission of Wiley-VCH)
2.1 Temperature Rising Elution Fractionation
31