

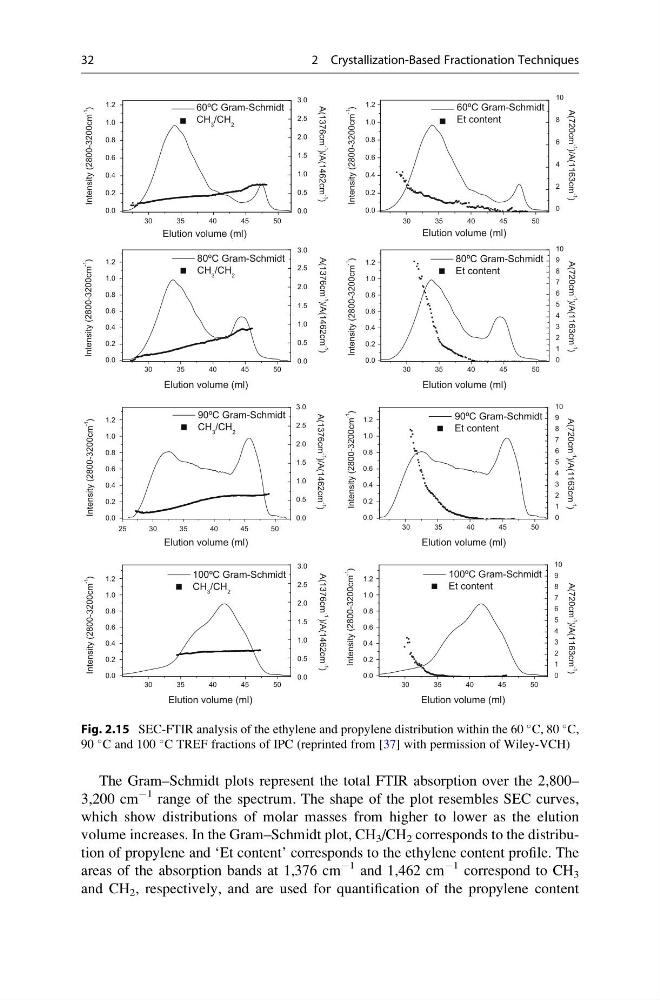
The Gram–Schmidt plots represent the total FTIR absorption over the 2,800–
3,200 cm
À1 range of the spectrum. The shape of the plot resembles SEC curves,
which show distributions of molar masses from higher to lower as the elution
volume increases. In the Gram–Schmidt plot, CH 3 /CH 2 corresponds to the distribution of propylene and ‘Et content’ corresponds to the ethylene content profile. The
areas of the absorption bands at 1,376 cm
À1 and 1,462 cm
À1 correspond to CH 3
and CH 2 , respectively, and are used for quantification of the propylene content
30
35
40
45
50
0.0
0.2
0.4
0.6
0.8
1.0
1.2
30
35
40
45
50
0.0
0.2
0.4
0.6
0.8
1.0
1.2
30
35
40
45
50
0.0
0.2
0.4
0.6
0.8
1.0
1.2
30
35
40
45
50
0.0
0.2
0.4
0.6
0.8
1.0
1.2
25
30
35
40
45
50
0.0
0.2
0.4
0.6
0.8
1.0
1.2
30
35
40
45
50
0.0
0.2
0.4
0.6
0.8
1.0
1.2
30
35
40
45
50
0.0
0.2
0.4
0.6
0.8
1.0
1.2
30
35
40
45
50
0.0
0.2
0.4
0.6
0.8
1.0
1.2
0.0
0.5
1.0
1.5
2.0
2.5
3.0
0
2
4
6
8
10
0.0
0.5
1.0
1.5
2.0
2.5
3.0
0
1
2
3
4
5
6
7
8
9
10
0.0
0.5
1.0
1.5
2.0
2.5
3.0
0
1
2
3
4
5
6
7
8
9
10
0.0
0.5
1.0
1.5
2.0
2.5
3.0
0
1
2
3
4
5
6
7
8
9
10
Intensity (2800-3200cm
-1
)
Elution volume (ml)
60ºC Gram-Schmidt
Et content
60ºC Gram-Schmidt
CH 3 /CH 2
Elution volume (ml)
Intensity (2800-3200cm
-1
)
80ºC Gram-Schmidt
CH 3 /CH 2
Intensity (2800-3200cm
-1
)
Elution volume (ml)
80ºC Gram-Schmidt
Et content
Intensity (2800-3200cm
-1
)
Elution volume (ml)
90ºC Gram-Schmidt
CH 3 /CH 2
Intensity (2800-3200cm
-1
)
Elution volume (ml)
90ºC Gram-Schmidt
Et content
Intensity (2800-3200cm
-1
)
Elution volume (ml)
100ºC Gram-Schmidt
CH 3 /CH 2
A(720cm
-1
)/A(1163cm
-1
)
A(720cm
-1
)/A(1163cm
-1
)
A(720cm
-1
)/A(1163cm
-1
)
A(720cm
-1
)/A(1163cm
-1
)
A(1376cm
-1 )/A(1462cm
-1
)
A(1376cm
-1
)/A(1462cm
-1
)
A(1376cm
-1
)/A(1462cm
-1
)
A(1376cm
-1
)/A(1462cm
-1
)
Intensity (2800-3200cm
-1
)
Elution volume (ml)
100ºC Gram-Schmidt
Et content
Intensity (2800-3200cm
-1
)
Elution volume (ml)
Fig. 2.15 SEC-FTIR analysis of the ethylene and propylene distribution within the 60
C, 80
C,
90
C and 100
C TREF fractions of IPC (reprinted from [37] with permission of Wiley-VCH)
32
2 Crystallization-Based Fractionation Techniques
3,200 cm
À1 range of the spectrum. The shape of the plot resembles SEC curves,
which show distributions of molar masses from higher to lower as the elution
volume increases. In the Gram–Schmidt plot, CH 3 /CH 2 corresponds to the distribution of propylene and ‘Et content’ corresponds to the ethylene content profile. The
areas of the absorption bands at 1,376 cm
À1 and 1,462 cm
À1 correspond to CH 3
and CH 2 , respectively, and are used for quantification of the propylene content
30
35
40
45
50
0.0
0.2
0.4
0.6
0.8
1.0
1.2
30
35
40
45
50
0.0
0.2
0.4
0.6
0.8
1.0
1.2
30
35
40
45
50
0.0
0.2
0.4
0.6
0.8
1.0
1.2
30
35
40
45
50
0.0
0.2
0.4
0.6
0.8
1.0
1.2
25
30
35
40
45
50
0.0
0.2
0.4
0.6
0.8
1.0
1.2
30
35
40
45
50
0.0
0.2
0.4
0.6
0.8
1.0
1.2
30
35
40
45
50
0.0
0.2
0.4
0.6
0.8
1.0
1.2
30
35
40
45
50
0.0
0.2
0.4
0.6
0.8
1.0
1.2
0.0
0.5
1.0
1.5
2.0
2.5
3.0
0
2
4
6
8
10
0.0
0.5
1.0
1.5
2.0
2.5
3.0
0
1
2
3
4
5
6
7
8
9
10
0.0
0.5
1.0
1.5
2.0
2.5
3.0
0
1
2
3
4
5
6
7
8
9
10
0.0
0.5
1.0
1.5
2.0
2.5
3.0
0
1
2
3
4
5
6
7
8
9
10
Intensity (2800-3200cm
-1
)
Elution volume (ml)
60ºC Gram-Schmidt
Et content
60ºC Gram-Schmidt
CH 3 /CH 2
Elution volume (ml)
Intensity (2800-3200cm
-1
)
80ºC Gram-Schmidt
CH 3 /CH 2
Intensity (2800-3200cm
-1
)
Elution volume (ml)
80ºC Gram-Schmidt
Et content
Intensity (2800-3200cm
-1
)
Elution volume (ml)
90ºC Gram-Schmidt
CH 3 /CH 2
Intensity (2800-3200cm
-1
)
Elution volume (ml)
90ºC Gram-Schmidt
Et content
Intensity (2800-3200cm
-1
)
Elution volume (ml)
100ºC Gram-Schmidt
CH 3 /CH 2
A(720cm
-1
)/A(1163cm
-1
)
A(720cm
-1
)/A(1163cm
-1
)
A(720cm
-1
)/A(1163cm
-1
)
A(720cm
-1
)/A(1163cm
-1
)
A(1376cm
-1 )/A(1462cm
-1
)
A(1376cm
-1
)/A(1462cm
-1
)
A(1376cm
-1
)/A(1462cm
-1
)
A(1376cm
-1
)/A(1462cm
-1
)
Intensity (2800-3200cm
-1
)
Elution volume (ml)
100ºC Gram-Schmidt
Et content
Intensity (2800-3200cm
-1
)
Elution volume (ml)
Fig. 2.15 SEC-FTIR analysis of the ethylene and propylene distribution within the 60
C, 80
C,
90
C and 100
C TREF fractions of IPC (reprinted from [37] with permission of Wiley-VCH)
32
2 Crystallization-Based Fractionation Techniques