

2.1.2.5 Fraction Analysis and Evaluation
The molar masses of the bulk polymer and the TREF fractions were analysed by
SEC. As can be seen in Fig. 2.13, a number of fractions exhibit monomodal MMDs
while others are bimodal. Such molar mass bimodality might indicate compositional heterogeneity. This has frequently been observed for the mid-elution temperature fractions of IPC fractionated by TREF [62, 66, 67] where semi-crystalline
EPC and PP homopolymer co-elute due to the isotacticity distribution found in PP
[62, 68]. PP homopolymer will not elute entirely at high TREF temperatures,
because PP fractions of lower isotacticity will become soluble within the same
lower temperature range of the semi-crystalline EPC phase of corresponding
crystallizability.
Additional evidence for the complexity of the TREF fractions is obtained from
the thermal behaviour, as shown in Fig. 2.14 for the DSC heating curves.
As expected, no melting or crystallization is observed for the 30
C fraction. This
fraction is amorphous and contains random EP rubber and (perhaps) some low
molar mass PP with a low isotacticity. The higher temperature fractions (110
C and
120
C) have a single, distinct melting peak around 160
C, which confirms the
monomodality of fractions containing predominantly iPP. The fractions eluting at
lower temperatures (60–100
C) show bimodalities with two melt endotherms,
indicating the presence of two distinct crystallizable components. Furthermore,
the fractions show an increase in melting temperatures for both endotherms from
the 60
C fraction to the 100
C fraction, which is a clear indication of an increase in
crystallinity of both components with increasing elution temperature. The appearance of two melt endotherms for the mid-elution fractions confirms the assumption
derived from the SEC curves that these fractions exhibit a significant compositional
heterogeneity. SEC, however, separates according to molecular size and not chemical composition. Therefore, bimodality in the SEC profiles does not conclusively
prove a chemical heterogeneity. One way to overcome this problem is to couple
SEC with a selective detector such as FTIR, as has been shown in Sect. 2.1.1. In the
present case, however, the LC-Transform interface is used instead of a flow cell.
The operation of this device has been described elsewhere and a number of
important applications have been presented [14, 69]. The advantage of this
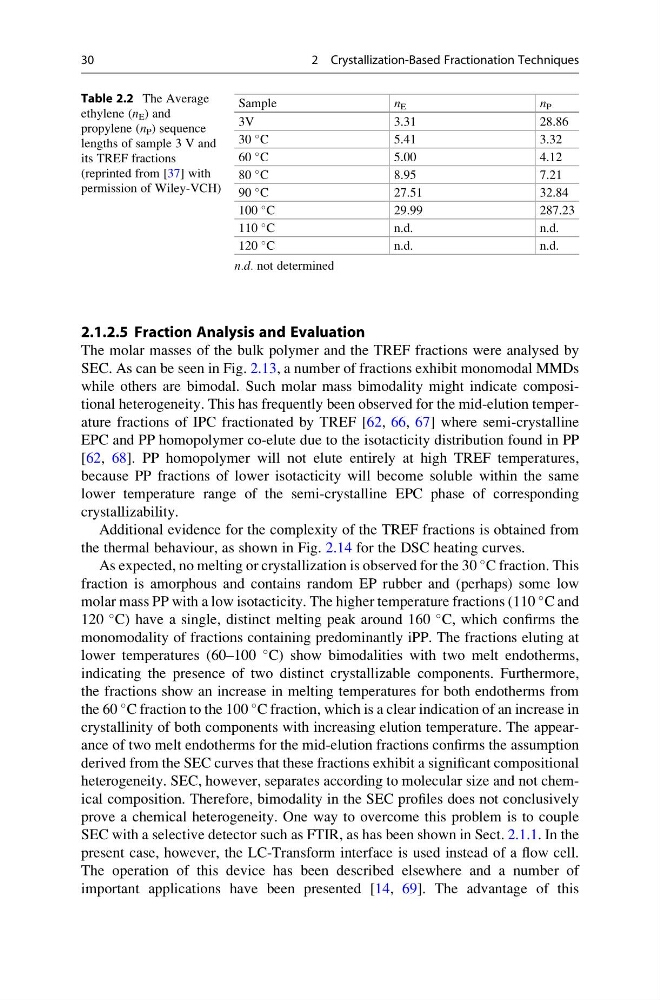
Table 2.2 The Average
ethylene (n E ) and
propylene (n P ) sequence
lengths of sample 3 V and
its TREF fractions
(reprinted from [37] with
permission of Wiley-VCH)
Sample
n E
n P
3V
3.31
28.86
30
C
5.41
3.32
60
C
5.00
4.12
80
C
8.95
7.21
90
C
27.51
32.84
100
C
29.99
287.23
110
C
n.d.
n.d.
120
C
n.d.
n.d.
n.d. not determined
30
2 Crystallization-Based Fractionation Techniques
The molar masses of the bulk polymer and the TREF fractions were analysed by
SEC. As can be seen in Fig. 2.13, a number of fractions exhibit monomodal MMDs
while others are bimodal. Such molar mass bimodality might indicate compositional heterogeneity. This has frequently been observed for the mid-elution temperature fractions of IPC fractionated by TREF [62, 66, 67] where semi-crystalline
EPC and PP homopolymer co-elute due to the isotacticity distribution found in PP
[62, 68]. PP homopolymer will not elute entirely at high TREF temperatures,
because PP fractions of lower isotacticity will become soluble within the same
lower temperature range of the semi-crystalline EPC phase of corresponding
crystallizability.
Additional evidence for the complexity of the TREF fractions is obtained from
the thermal behaviour, as shown in Fig. 2.14 for the DSC heating curves.
As expected, no melting or crystallization is observed for the 30
C fraction. This
fraction is amorphous and contains random EP rubber and (perhaps) some low
molar mass PP with a low isotacticity. The higher temperature fractions (110
C and
120
C) have a single, distinct melting peak around 160
C, which confirms the
monomodality of fractions containing predominantly iPP. The fractions eluting at
lower temperatures (60–100
C) show bimodalities with two melt endotherms,
indicating the presence of two distinct crystallizable components. Furthermore,
the fractions show an increase in melting temperatures for both endotherms from
the 60
C fraction to the 100
C fraction, which is a clear indication of an increase in
crystallinity of both components with increasing elution temperature. The appearance of two melt endotherms for the mid-elution fractions confirms the assumption
derived from the SEC curves that these fractions exhibit a significant compositional
heterogeneity. SEC, however, separates according to molecular size and not chemical composition. Therefore, bimodality in the SEC profiles does not conclusively
prove a chemical heterogeneity. One way to overcome this problem is to couple
SEC with a selective detector such as FTIR, as has been shown in Sect. 2.1.1. In the
present case, however, the LC-Transform interface is used instead of a flow cell.
The operation of this device has been described elsewhere and a number of
important applications have been presented [14, 69]. The advantage of this
Table 2.2 The Average
ethylene (n E ) and
propylene (n P ) sequence
lengths of sample 3 V and
its TREF fractions
(reprinted from [37] with
permission of Wiley-VCH)
Sample
n E
n P
3V
3.31
28.86
30
C
5.41
3.32
60
C
5.00
4.12
80
C
8.95
7.21
90
C
27.51
32.84
100
C
29.99
287.23
110
C
n.d.
n.d.
120
C
n.d.
n.d.
n.d. not determined
30
2 Crystallization-Based Fractionation Techniques