

samples in HT-SEC. The late co-elution of large branched macromolecules with
small linear macromolecules affects the R g values more pronouncedly than the
molar mass values.
As no stationary phase is involved in HT-AF4, the co-elution effects are avoided.
With increasing elution volume, the molar mass as well as R g increase steadily.
Consequently, HT-AF4 allows access to the lower R g values that could not be
obtained by HT-SEC. A linear dependence between R g and the elution volume over
the entire molar mass range is shown for HT-AF4 in contrary to HT-SEC, which is a
clear indication for the separation of the macromolecules with respect to hydrodynamic size for the entire sample.
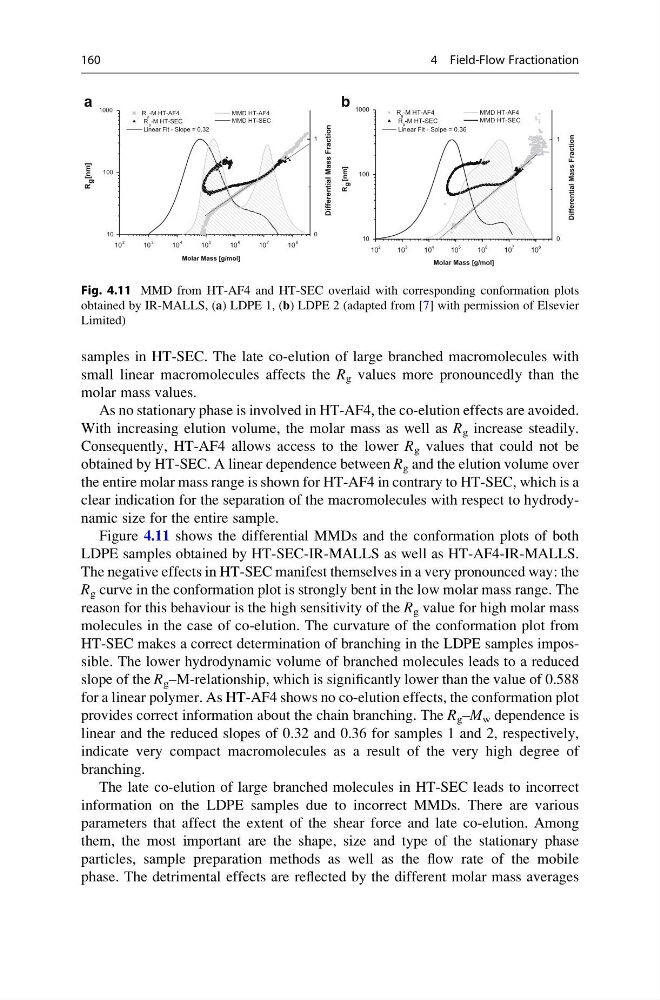
Figure 4.11 shows the differential MMDs and the conformation plots of both
LDPE samples obtained by HT-SEC-IR-MALLS as well as HT-AF4-IR-MALLS.
The negative effects in HT-SEC manifest themselves in a very pronounced way: the
R g curve in the conformation plot is strongly bent in the low molar mass range. The
reason for this behaviour is the high sensitivity of the R g value for high molar mass
molecules in the case of co-elution. The curvature of the conformation plot from
HT-SEC makes a correct determination of branching in the LDPE samples impossible. The lower hydrodynamic volume of branched molecules leads to a reduced
slope of the R g –M-relationship, which is significantly lower than the value of 0.588
for a linear polymer. As HT-AF4 shows no co-elution effects, the conformation plot
provides correct information about the chain branching. The R g –M w dependence is
linear and the reduced slopes of 0.32 and 0.36 for samples 1 and 2, respectively,
indicate very compact macromolecules as a result of the very high degree of
branching.
The late co-elution of large branched molecules in HT-SEC leads to incorrect
information on the LDPE samples due to incorrect MMDs. There are various
parameters that affect the extent of the shear force and late co-elution. Among
them, the most important are the shape, size and type of the stationary phase
particles, sample preparation methods as well as the flow rate of the mobile
phase. The detrimental effects are reflected by the different molar mass averages
10 2
10 3
10 4
10 5
10 6
10 7
10 8
10
100
1000
R g -M HT-AF4
R g -M HT-SEC
Linear Fit - Slope = 0.32
R
g [nm]
Molar Mass [g/mol]
0
1
MMD HT-AF4
MMD HT-SEC
Differential Mass Fraction
10
2
10
3
10
4
10
5
10
6
10
7
10
8
10
100
1000
R g -M HT-AF4
R g -M HT-SEC
Linear Fit - Solpe = 0.36
R
g [nm]
Molar Mass [g/mol]
0
1
MMD HT-AF4
MMD HT-SEC
Differential Mass Fraction
a
b
Fig. 4.11 MMD from HT-AF4 and HT-SEC overlaid with corresponding conformation plots
obtained by IR-MALLS, (a) LDPE 1, (b) LDPE 2 (adapted from [7] with permission of Elsevier
Limited)
160
4 Field-Flow Fractionation
small linear macromolecules affects the R g values more pronouncedly than the
molar mass values.
As no stationary phase is involved in HT-AF4, the co-elution effects are avoided.
With increasing elution volume, the molar mass as well as R g increase steadily.
Consequently, HT-AF4 allows access to the lower R g values that could not be
obtained by HT-SEC. A linear dependence between R g and the elution volume over
the entire molar mass range is shown for HT-AF4 in contrary to HT-SEC, which is a
clear indication for the separation of the macromolecules with respect to hydrodynamic size for the entire sample.
Figure 4.11 shows the differential MMDs and the conformation plots of both
LDPE samples obtained by HT-SEC-IR-MALLS as well as HT-AF4-IR-MALLS.
The negative effects in HT-SEC manifest themselves in a very pronounced way: the
R g curve in the conformation plot is strongly bent in the low molar mass range. The
reason for this behaviour is the high sensitivity of the R g value for high molar mass
molecules in the case of co-elution. The curvature of the conformation plot from
HT-SEC makes a correct determination of branching in the LDPE samples impossible. The lower hydrodynamic volume of branched molecules leads to a reduced
slope of the R g –M-relationship, which is significantly lower than the value of 0.588
for a linear polymer. As HT-AF4 shows no co-elution effects, the conformation plot
provides correct information about the chain branching. The R g –M w dependence is
linear and the reduced slopes of 0.32 and 0.36 for samples 1 and 2, respectively,
indicate very compact macromolecules as a result of the very high degree of
branching.
The late co-elution of large branched molecules in HT-SEC leads to incorrect
information on the LDPE samples due to incorrect MMDs. There are various
parameters that affect the extent of the shear force and late co-elution. Among
them, the most important are the shape, size and type of the stationary phase
particles, sample preparation methods as well as the flow rate of the mobile
phase. The detrimental effects are reflected by the different molar mass averages
10 2
10 3
10 4
10 5
10 6
10 7
10 8
10
100
1000
R g -M HT-AF4
R g -M HT-SEC
Linear Fit - Slope = 0.32
R
g [nm]
Molar Mass [g/mol]
0
1
MMD HT-AF4
MMD HT-SEC
Differential Mass Fraction
10
2
10
3
10
4
10
5
10
6
10
7
10
8
10
100
1000
R g -M HT-AF4
R g -M HT-SEC
Linear Fit - Solpe = 0.36
R
g [nm]
Molar Mass [g/mol]
0
1
MMD HT-AF4
MMD HT-SEC
Differential Mass Fraction
a
b
Fig. 4.11 MMD from HT-AF4 and HT-SEC overlaid with corresponding conformation plots
obtained by IR-MALLS, (a) LDPE 1, (b) LDPE 2 (adapted from [7] with permission of Elsevier
Limited)
160
4 Field-Flow Fractionation