

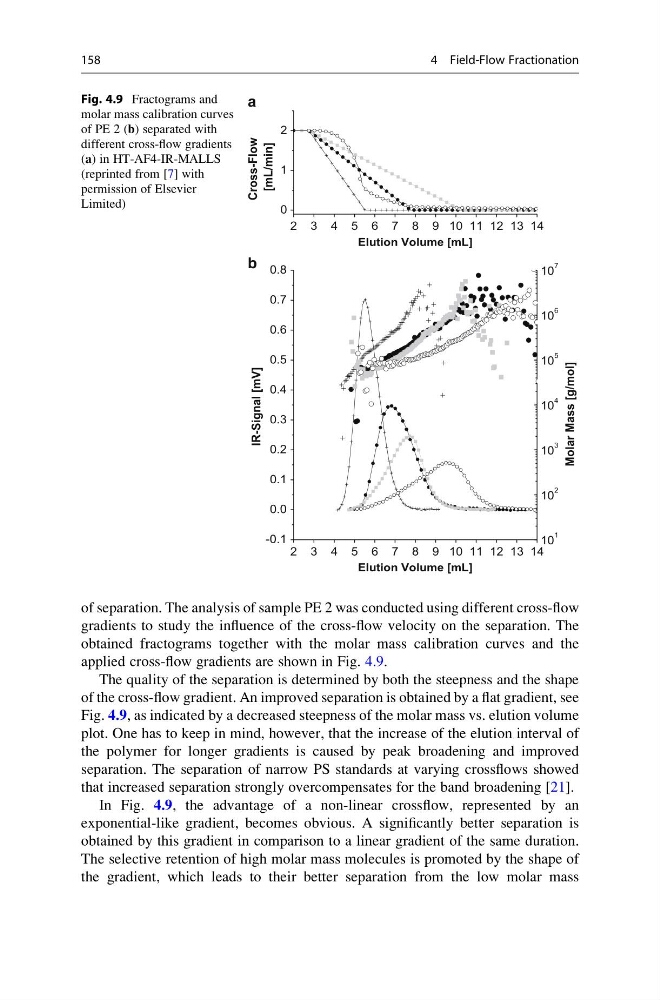
of separation. The analysis of sample PE 2 was conducted using different cross-flow
gradients to study the influence of the cross-flow velocity on the separation. The
obtained fractograms together with the molar mass calibration curves and the
applied cross-flow gradients are shown in Fig. 4.9.
The quality of the separation is determined by both the steepness and the shape
of the cross-flow gradient. An improved separation is obtained by a flat gradient, see
Fig. 4.9, as indicated by a decreased steepness of the molar mass vs. elution volume
plot. One has to keep in mind, however, that the increase of the elution interval of
the polymer for longer gradients is caused by peak broadening and improved
separation. The separation of narrow PS standards at varying crossflows showed
that increased separation strongly overcompensates for the band broadening [21].
In Fig. 4.9, the advantage of a non-linear crossflow, represented by an
exponential-like gradient, becomes obvious. A significantly better separation is
obtained by this gradient in comparison to a linear gradient of the same duration.
The selective retention of high molar mass molecules is promoted by the shape of
the gradient, which leads to their better separation from the low molar mass
2 3 4 5 6 7 8 9 10 11 12 13 14
-0.1
0.0
0.1
0.2
0.3
0.4
0.5
0.6
0.7
0.8
IR-Signal [mV]
Elution Volume [mL]
10
1
10
2
10
3
10
4
10
5
10
6
10
7
Molar Mass [g/mol]
2 3 4 5 6 7 8 9 10 11 12 13 14
0
1
2
Cross-Flow
[mL/min]
Elution Volume [mL]
a
b
Fig. 4.9 Fractograms and
molar mass calibration curves
of PE 2 (b) separated with
different cross-flow gradients
(a) in HT-AF4-IR-MALLS
(reprinted from [7] with
permission of Elsevier
Limited)
158
4 Field-Flow Fractionation
gradients to study the influence of the cross-flow velocity on the separation. The
obtained fractograms together with the molar mass calibration curves and the
applied cross-flow gradients are shown in Fig. 4.9.
The quality of the separation is determined by both the steepness and the shape
of the cross-flow gradient. An improved separation is obtained by a flat gradient, see
Fig. 4.9, as indicated by a decreased steepness of the molar mass vs. elution volume
plot. One has to keep in mind, however, that the increase of the elution interval of
the polymer for longer gradients is caused by peak broadening and improved
separation. The separation of narrow PS standards at varying crossflows showed
that increased separation strongly overcompensates for the band broadening [21].
In Fig. 4.9, the advantage of a non-linear crossflow, represented by an
exponential-like gradient, becomes obvious. A significantly better separation is
obtained by this gradient in comparison to a linear gradient of the same duration.
The selective retention of high molar mass molecules is promoted by the shape of
the gradient, which leads to their better separation from the low molar mass
2 3 4 5 6 7 8 9 10 11 12 13 14
-0.1
0.0
0.1
0.2
0.3
0.4
0.5
0.6
0.7
0.8
IR-Signal [mV]
Elution Volume [mL]
10
1
10
2
10
3
10
4
10
5
10
6
10
7
Molar Mass [g/mol]
2 3 4 5 6 7 8 9 10 11 12 13 14
0
1
2
Cross-Flow
[mL/min]
Elution Volume [mL]
a
b
Fig. 4.9 Fractograms and
molar mass calibration curves
of PE 2 (b) separated with
different cross-flow gradients
(a) in HT-AF4-IR-MALLS
(reprinted from [7] with
permission of Elsevier
Limited)
158
4 Field-Flow Fractionation