

differentiate between both samples according to the exact CCD, present in the
various TREF fractions.
3.4.3.5 Measurement and Evaluation
To achieve the separation with regard to chemical composition of such complex
polymeric materials in a fast and efficient manner, P-TREF must be combined with
HT-HPLC, which reveals separation according to chemical composition and microstructure. The current study made use of the combination of P-TREF and
HT-HPLC, with the additional use of FTIR as a composition detection method
after HT-HPLC. The experimental set-up of the coupled HPLC-FTIR system is
schematically presented in Fig. 3.49. All chromatographic separations are carried
out on the SGIC system. From the column outlet, a heated transfer line is connected
to the LC-Transform system. Fractions from chromatography are automatically
sprayed on the germanium disc or a disc covered with aluminium foil.
The present system was used to separate the TREF fractions according to
chemical composition by HT-HPLC. The corresponding chromatograms for
samples 3V and 3VA are summarized in Fig. 3.50.
As reported by Pasch and Macko [85], linear ethylene sequences are strongly
retained on the Hypercarb stationary phase and elute later than short ethylene
sequences, while linear propylene sequences are not retained to the same extent.
Although the chemical composition is the primary parameter and it governs the
separation, the molar mass of the components also plays a role, especially for low
molar masses. For all the TREF fractions, a fraction of iPP homopolymer having a
low molar mass is not absorbed on the column, but elutes in 100 % 1-decanol before
the start of the gradient. The concentration of this component increases as the TREF
fractionation temperature increases.
The components of the 30
C fraction are expected to be EP random copolymers,
with some atactic PP or branched PE homopolymer being present. This can be seen
40
60
80
100
120
140
160
180
130
0
C
120
0
C
110
0
C
100
0
C
90
0
C
80
0
C
60
0
C
Heat Flow (W/g) a.u
Temperature (°C)
30
0
C
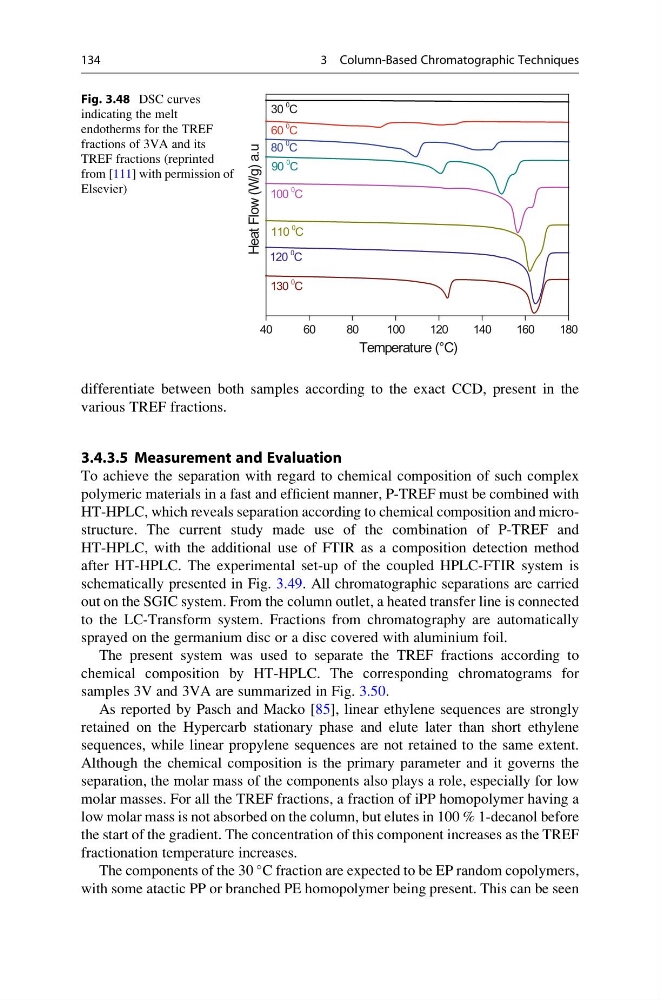
Fig. 3.48 DSC curves
indicating the melt
endotherms for the TREF
fractions of 3VA and its
TREF fractions (reprinted
from [111] with permission of
Elsevier)
134
3 Column-Based Chromatographic Techniques
various TREF fractions.
3.4.3.5 Measurement and Evaluation
To achieve the separation with regard to chemical composition of such complex
polymeric materials in a fast and efficient manner, P-TREF must be combined with
HT-HPLC, which reveals separation according to chemical composition and microstructure. The current study made use of the combination of P-TREF and
HT-HPLC, with the additional use of FTIR as a composition detection method
after HT-HPLC. The experimental set-up of the coupled HPLC-FTIR system is
schematically presented in Fig. 3.49. All chromatographic separations are carried
out on the SGIC system. From the column outlet, a heated transfer line is connected
to the LC-Transform system. Fractions from chromatography are automatically
sprayed on the germanium disc or a disc covered with aluminium foil.
The present system was used to separate the TREF fractions according to
chemical composition by HT-HPLC. The corresponding chromatograms for
samples 3V and 3VA are summarized in Fig. 3.50.
As reported by Pasch and Macko [85], linear ethylene sequences are strongly
retained on the Hypercarb stationary phase and elute later than short ethylene
sequences, while linear propylene sequences are not retained to the same extent.
Although the chemical composition is the primary parameter and it governs the
separation, the molar mass of the components also plays a role, especially for low
molar masses. For all the TREF fractions, a fraction of iPP homopolymer having a
low molar mass is not absorbed on the column, but elutes in 100 % 1-decanol before
the start of the gradient. The concentration of this component increases as the TREF
fractionation temperature increases.
The components of the 30
C fraction are expected to be EP random copolymers,
with some atactic PP or branched PE homopolymer being present. This can be seen
40
60
80
100
120
140
160
180
130
0
C
120
0
C
110
0
C
100
0
C
90
0
C
80
0
C
60
0
C
Heat Flow (W/g) a.u
Temperature (°C)
30
0
C
Fig. 3.48 DSC curves
indicating the melt
endotherms for the TREF
fractions of 3VA and its
TREF fractions (reprinted
from [111] with permission of
Elsevier)
134
3 Column-Based Chromatographic Techniques