

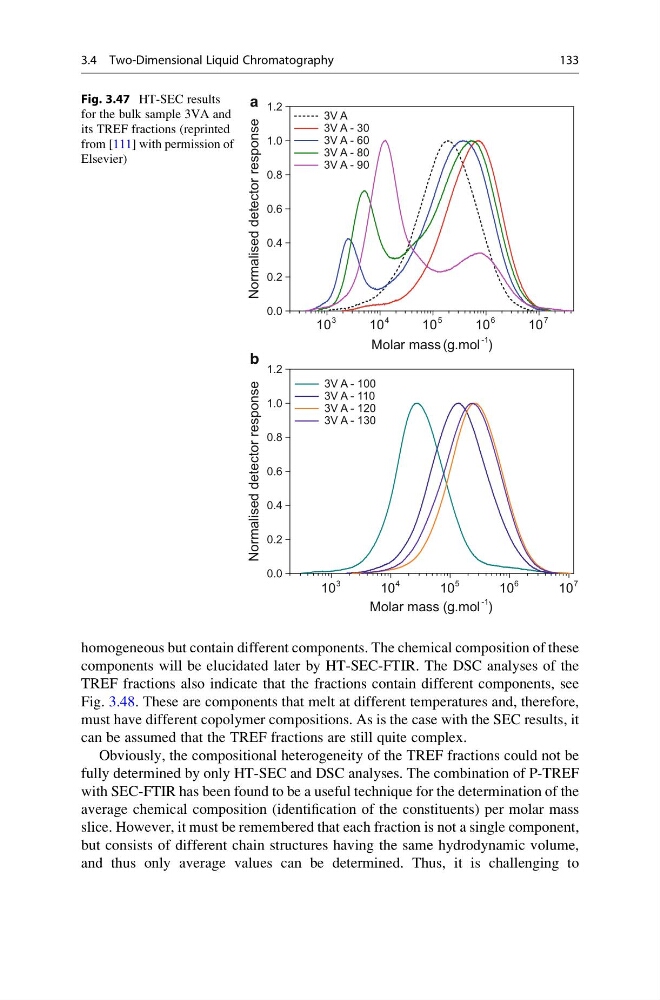
homogeneous but contain different components. The chemical composition of these
components will be elucidated later by HT-SEC-FTIR. The DSC analyses of the
TREF fractions also indicate that the fractions contain different components, see
Fig. 3.48. These are components that melt at different temperatures and, therefore,
must have different copolymer compositions. As is the case with the SEC results, it
can be assumed that the TREF fractions are still quite complex.
Obviously, the compositional heterogeneity of the TREF fractions could not be
fully determined by only HT-SEC and DSC analyses. The combination of P-TREF
with SEC-FTIR has been found to be a useful technique for the determination of the
average chemical composition (identification of the constituents) per molar mass
slice. However, it must be remembered that each fraction is not a single component,
but consists of different chain structures having the same hydrodynamic volume,
and thus only average values can be determined. Thus, it is challenging to
10
3
10
4
10
5
10
6
10
7
0.0
0.2
0.4
0.6
0.8
1.0
1.2
3V A
3V A - 30
3V A - 60
3V A - 80
3V A - 90
Normalised detector response
Molar mass (g.mol
-1
)
10
3
10
4
10
5
10
6
10
7
0.0
0.2
0.4
0.6
0.8
1.0
1.2
Normalised detector response
Molar mass (g.mol
-1
)
3V A - 100
3V A - 110
3V A - 120
3V A - 130
a
b
Fig. 3.47 HT-SEC results
for the bulk sample 3VA and
its TREF fractions (reprinted
from [111] with permission of
Elsevier)
3.4 Two-Dimensional Liquid Chromatography
133
components will be elucidated later by HT-SEC-FTIR. The DSC analyses of the
TREF fractions also indicate that the fractions contain different components, see
Fig. 3.48. These are components that melt at different temperatures and, therefore,
must have different copolymer compositions. As is the case with the SEC results, it
can be assumed that the TREF fractions are still quite complex.
Obviously, the compositional heterogeneity of the TREF fractions could not be
fully determined by only HT-SEC and DSC analyses. The combination of P-TREF
with SEC-FTIR has been found to be a useful technique for the determination of the
average chemical composition (identification of the constituents) per molar mass
slice. However, it must be remembered that each fraction is not a single component,
but consists of different chain structures having the same hydrodynamic volume,
and thus only average values can be determined. Thus, it is challenging to
10
3
10
4
10
5
10
6
10
7
0.0
0.2
0.4
0.6
0.8
1.0
1.2
3V A
3V A - 30
3V A - 60
3V A - 80
3V A - 90
Normalised detector response
Molar mass (g.mol
-1
)
10
3
10
4
10
5
10
6
10
7
0.0
0.2
0.4
0.6
0.8
1.0
1.2
Normalised detector response
Molar mass (g.mol
-1
)
3V A - 100
3V A - 110
3V A - 120
3V A - 130
a
b
Fig. 3.47 HT-SEC results
for the bulk sample 3VA and
its TREF fractions (reprinted
from [111] with permission of
Elsevier)
3.4 Two-Dimensional Liquid Chromatography
133