

3.3.1.3 Equipment
• TGIC instrument. CEF instrument (Polymer Char, Valencia, Spain) connected to
a Spectra Chrom model CF-1 fraction collector (Spectrum Chromatography,
Houston, USA). For the prep fractionations, nine fractions were collected at
2 min intervals. Twenty repetitive injections were made.
• Columns. Hypercarb (Thermo Scientific, Dreieich, Germany), 100 mm  4.6 mm
i.d., average particle size 7 μm, average pore size 250 A ˚ .
• Mobile phase. ODCB.
• Detectors. Two-channel IR-4 (PolymerChar, Valencia, Spain), two-angle (15
and 90
) LS detector (Precision Detectors), two-capillary viscometer.
• Column temperature. Temperature gradient.
• Sample concentration. 2 mg/mL. All samples are dissolved in ODCB at 160
C.
• Injection volume. 200 μL.
3.3.1.4 Preparatory Investigations
The HT-TGIC experiment consists of the following steps: (1) injection of the
sample at a constant temperature, (2) adsorption of the polymer on the column by
decreasing the column temperature and (3) elution of the polymer components by
increasing the column temperature with a moderate solvent flow. The column
process (2) can be carried out with (similar to CEF) or without flow. To obtain
optimum separation, a number of experimental variables can be changed including
the column cooling and heating rates, and the solvent flow. The definition of the
experimental variables of TGIC is listed in Table 3.7.
In the present case, the optimum experimental conditions are the following:
stabilization temperature (T s ) 140
C, stabilization rate (R s ) 40
C/min, stabilization
time (t loop ) 2 min and precooling time (t column ) 2 min. Many other factors can affect the
results. To simplify the identification of any specific HT-TGIC run conditions, the
following run-ID convention was adopted by Cong et al. [57]: TGIC 140
C_0
C_175
C_6
C/min_3
C/min_0.03 mL/min_0.5 mL/min, representing the following experimental conditions: stabilization temperature (
C)_final temperature during cooling
process (
C)_final temperature during elution process (
C)_cooling rate during cooling
process (
C/min)_heating rate during elution process (
C/min)_flow rate during
cooling process (mL/min)_flow rate during elution process (mL/min), respectively.
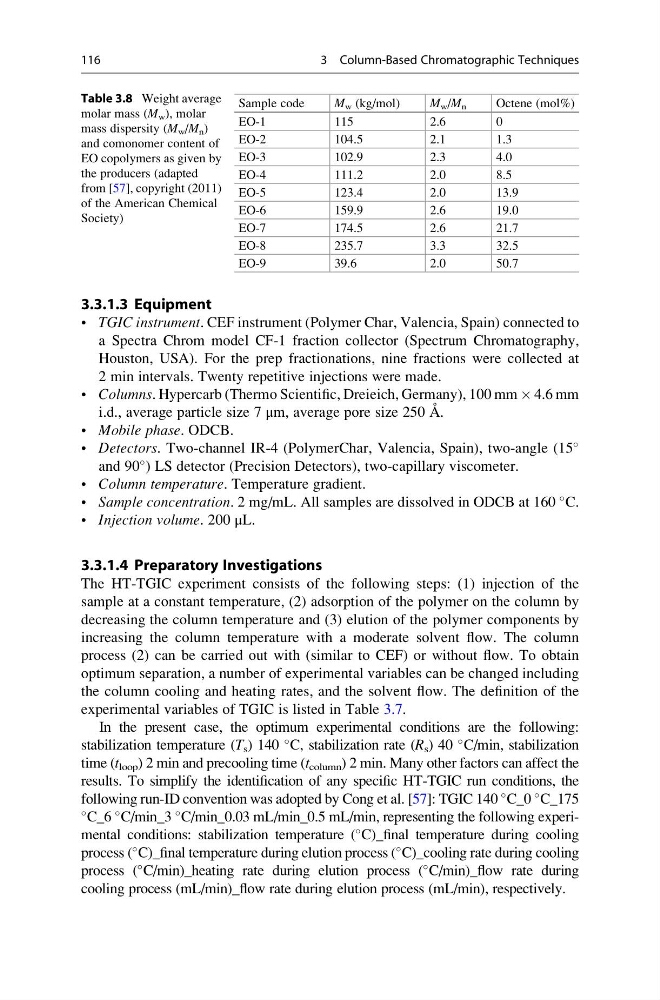
Table 3.8 Weight average
molar mass (M w ), molar
mass dispersity (M w /M n )
and comonomer content of
EO copolymers as given by
the producers (adapted
from [57], copyright (2011)
of the American Chemical
Society)
Sample code
M w (kg/mol)
M w /M n
Octene (mol%)
EO-1
115
2.6
0
EO-2
104.5
2.1
1.3
EO-3
102.9
2.3
4.0
EO-4
111.2
2.0
8.5
EO-5
123.4
2.0
13.9
EO-6
159.9
2.6
19.0
EO-7
174.5
2.6
21.7
EO-8
235.7
3.3
32.5
EO-9
39.6
2.0
50.7
116
3 Column-Based Chromatographic Techniques
• TGIC instrument. CEF instrument (Polymer Char, Valencia, Spain) connected to
a Spectra Chrom model CF-1 fraction collector (Spectrum Chromatography,
Houston, USA). For the prep fractionations, nine fractions were collected at
2 min intervals. Twenty repetitive injections were made.
• Columns. Hypercarb (Thermo Scientific, Dreieich, Germany), 100 mm  4.6 mm
i.d., average particle size 7 μm, average pore size 250 A ˚ .
• Mobile phase. ODCB.
• Detectors. Two-channel IR-4 (PolymerChar, Valencia, Spain), two-angle (15
and 90
) LS detector (Precision Detectors), two-capillary viscometer.
• Column temperature. Temperature gradient.
• Sample concentration. 2 mg/mL. All samples are dissolved in ODCB at 160
C.
• Injection volume. 200 μL.
3.3.1.4 Preparatory Investigations
The HT-TGIC experiment consists of the following steps: (1) injection of the
sample at a constant temperature, (2) adsorption of the polymer on the column by
decreasing the column temperature and (3) elution of the polymer components by
increasing the column temperature with a moderate solvent flow. The column
process (2) can be carried out with (similar to CEF) or without flow. To obtain
optimum separation, a number of experimental variables can be changed including
the column cooling and heating rates, and the solvent flow. The definition of the
experimental variables of TGIC is listed in Table 3.7.
In the present case, the optimum experimental conditions are the following:
stabilization temperature (T s ) 140
C, stabilization rate (R s ) 40
C/min, stabilization
time (t loop ) 2 min and precooling time (t column ) 2 min. Many other factors can affect the
results. To simplify the identification of any specific HT-TGIC run conditions, the
following run-ID convention was adopted by Cong et al. [57]: TGIC 140
C_0
C_175
C_6
C/min_3
C/min_0.03 mL/min_0.5 mL/min, representing the following experimental conditions: stabilization temperature (
C)_final temperature during cooling
process (
C)_final temperature during elution process (
C)_cooling rate during cooling
process (
C/min)_heating rate during elution process (
C/min)_flow rate during
cooling process (mL/min)_flow rate during elution process (mL/min), respectively.
Table 3.8 Weight average
molar mass (M w ), molar
mass dispersity (M w /M n )
and comonomer content of
EO copolymers as given by
the producers (adapted
from [57], copyright (2011)
of the American Chemical
Society)
Sample code
M w (kg/mol)
M w /M n
Octene (mol%)
EO-1
115
2.6
0
EO-2
104.5
2.1
1.3
EO-3
102.9
2.3
4.0
EO-4
111.2
2.0
8.5
EO-5
123.4
2.0
13.9
EO-6
159.9
2.6
19.0
EO-7
174.5
2.6
21.7
EO-8
235.7
3.3
32.5
EO-9
39.6
2.0
50.7
116
3 Column-Based Chromatographic Techniques