

separate EO copolymers completely, irrespective of crystallinity, and exclusively
regarding adsorptive interactions.
3.3.1.2 Materials
• Standards. Linear HDPE standards with peak molar masses of 2.1–1,100 kg/mol
(Polymer Labs, Church Stretton, UK).
• Polymers. EO copolymers synthesized using a constrained geometry catalyst
from Dow Chemical (Freeport, USA). The compositions and molar masses of
the copolymers are summarized in Table 3.8.
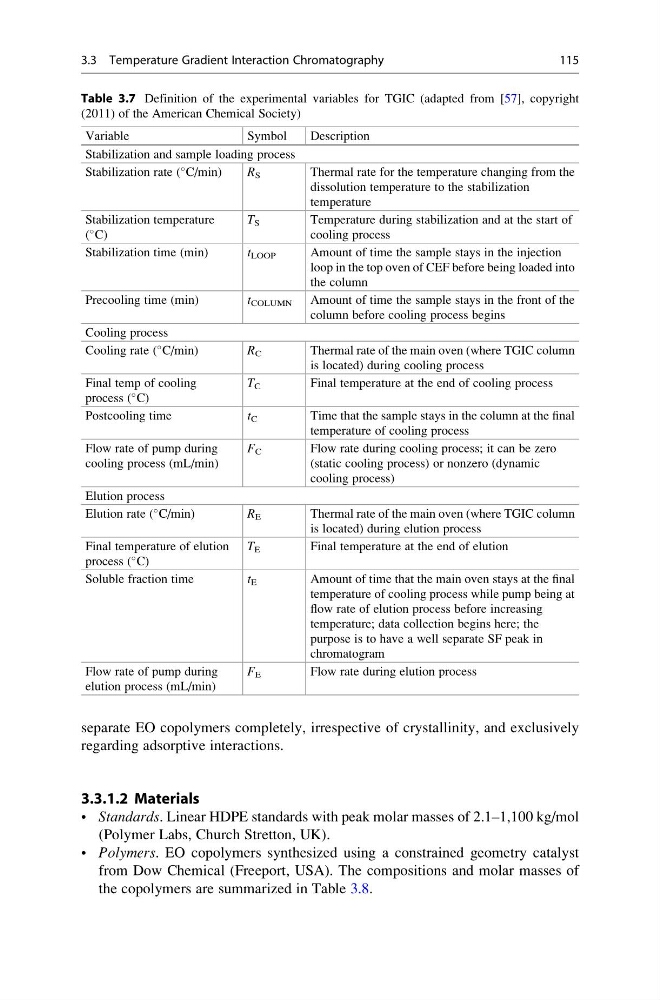
Table 3.7 Definition of the experimental variables for TGIC (adapted from [57], copyright
(2011) of the American Chemical Society)
Variable
Symbol
Description
Stabilization and sample loading process
Stabilization rate (
C/min)
R S
Thermal rate for the temperature changing from the
dissolution temperature to the stabilization
temperature
Stabilization temperature
(
C)
T S
Temperature during stabilization and at the start of
cooling process
Stabilization time (min)
t LOOP
Amount of time the sample stays in the injection
loop in the top oven of CEF before being loaded into
the column
Precooling time (min)
t COLUMN Amount of time the sample stays in the front of the
column before cooling process begins
Cooling process
Cooling rate (
C/min)
R C
Thermal rate of the main oven (where TGIC column
is located) during cooling process
Final temp of cooling
process (
C)
T C
Final temperature at the end of cooling process
Postcooling time
t C
Time that the sample stays in the column at the final
temperature of cooling process
Flow rate of pump during
cooling process (mL/min)
F C
Flow rate during cooling process; it can be zero
(static cooling process) or nonzero (dynamic
cooling process)
Elution process
Elution rate (
C/min)
R E
Thermal rate of the main oven (where TGIC column
is located) during elution process
Final temperature of elution
process (
C)
T E
Final temperature at the end of elution
Soluble fraction time
t E
Amount of time that the main oven stays at the final
temperature of cooling process while pump being at
flow rate of elution process before increasing
temperature; data collection begins here; the
purpose is to have a well separate SF peak in
chromatogram
Flow rate of pump during
elution process (mL/min)
F E
Flow rate during elution process
3.3 Temperature Gradient Interaction Chromatography
115
regarding adsorptive interactions.
3.3.1.2 Materials
• Standards. Linear HDPE standards with peak molar masses of 2.1–1,100 kg/mol
(Polymer Labs, Church Stretton, UK).
• Polymers. EO copolymers synthesized using a constrained geometry catalyst
from Dow Chemical (Freeport, USA). The compositions and molar masses of
the copolymers are summarized in Table 3.8.
Table 3.7 Definition of the experimental variables for TGIC (adapted from [57], copyright
(2011) of the American Chemical Society)
Variable
Symbol
Description
Stabilization and sample loading process
Stabilization rate (
C/min)
R S
Thermal rate for the temperature changing from the
dissolution temperature to the stabilization
temperature
Stabilization temperature
(
C)
T S
Temperature during stabilization and at the start of
cooling process
Stabilization time (min)
t LOOP
Amount of time the sample stays in the injection
loop in the top oven of CEF before being loaded into
the column
Precooling time (min)
t COLUMN Amount of time the sample stays in the front of the
column before cooling process begins
Cooling process
Cooling rate (
C/min)
R C
Thermal rate of the main oven (where TGIC column
is located) during cooling process
Final temp of cooling
process (
C)
T C
Final temperature at the end of cooling process
Postcooling time
t C
Time that the sample stays in the column at the final
temperature of cooling process
Flow rate of pump during
cooling process (mL/min)
F C
Flow rate during cooling process; it can be zero
(static cooling process) or nonzero (dynamic
cooling process)
Elution process
Elution rate (
C/min)
R E
Thermal rate of the main oven (where TGIC column
is located) during elution process
Final temperature of elution
process (
C)
T E
Final temperature at the end of elution
Soluble fraction time
t E
Amount of time that the main oven stays at the final
temperature of cooling process while pump being at
flow rate of elution process before increasing
temperature; data collection begins here; the
purpose is to have a well separate SF peak in
chromatogram
Flow rate of pump during
elution process (mL/min)
F E
Flow rate during elution process
3.3 Temperature Gradient Interaction Chromatography
115