

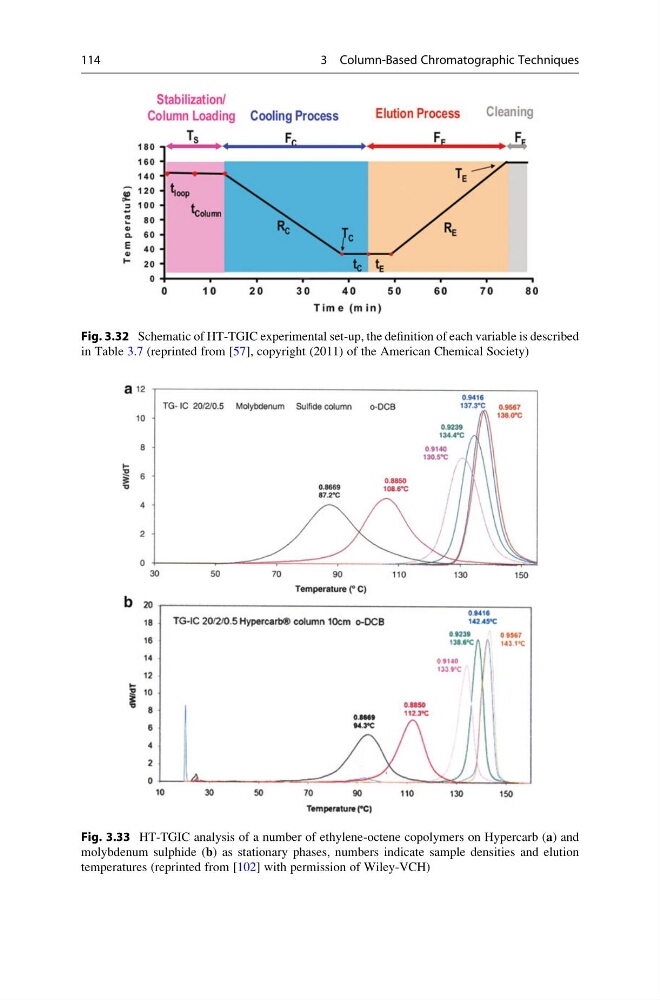
Fig. 3.32 Schematic of HT-TGIC experimental set-up, the definition of each variable is described
in Table 3.7 (reprinted from [57], copyright (2011) of the American Chemical Society)
Fig. 3.33 HT-TGIC analysis of a number of ethylene-octene copolymers on Hypercarb (a) and
molybdenum sulphide (b) as stationary phases, numbers indicate sample densities and elution
temperatures (reprinted from [102] with permission of Wiley-VCH)
114
3 Column-Based Chromatographic Techniques
in Table 3.7 (reprinted from [57], copyright (2011) of the American Chemical Society)
Fig. 3.33 HT-TGIC analysis of a number of ethylene-octene copolymers on Hypercarb (a) and
molybdenum sulphide (b) as stationary phases, numbers indicate sample densities and elution
temperatures (reprinted from [102] with permission of Wiley-VCH)
114
3 Column-Based Chromatographic Techniques