

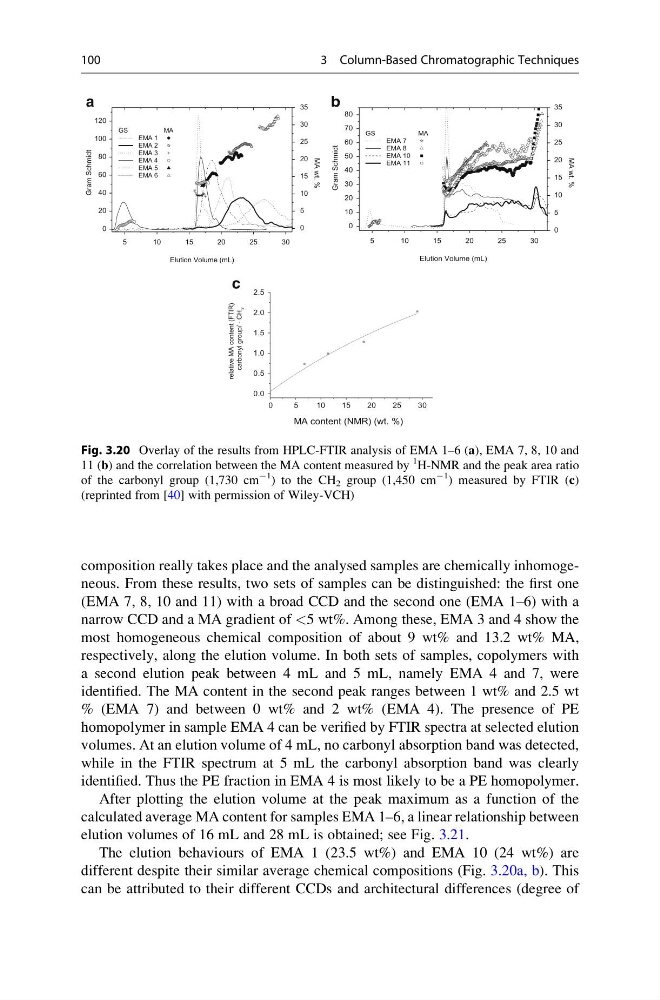
composition really takes place and the analysed samples are chemically inhomogeneous. From these results, two sets of samples can be distinguished: the first one
(EMA 7, 8, 10 and 11) with a broad CCD and the second one (EMA 1–6) with a
narrow CCD and a MA gradient of <5 wt%. Among these, EMA 3 and 4 show the
most homogeneous chemical composition of about 9 wt% and 13.2 wt% MA,
respectively, along the elution volume. In both sets of samples, copolymers with
a second elution peak between 4 mL and 5 mL, namely EMA 4 and 7, were
identified. The MA content in the second peak ranges between 1 wt% and 2.5 wt
% (EMA 7) and between 0 wt% and 2 wt% (EMA 4). The presence of PE
homopolymer in sample EMA 4 can be verified by FTIR spectra at selected elution
volumes. At an elution volume of 4 mL, no carbonyl absorption band was detected,
while in the FTIR spectrum at 5 mL the carbonyl absorption band was clearly
identified. Thus the PE fraction in EMA 4 is most likely to be a PE homopolymer.
After plotting the elution volume at the peak maximum as a function of the
calculated average MA content for samples EMA 1–6, a linear relationship between
elution volumes of 16 mL and 28 mL is obtained; see Fig. 3.21.
The elution behaviours of EMA 1 (23.5 wt%) and EMA 10 (24 wt%) are
different despite their similar average chemical compositions (Fig. 3.20a, b). This
can be attributed to their different CCDs and architectural differences (degree of
5
1 0
1 5
2 0
2 5
3 0
0
10
20
30
40
50
60
70
80
GS
MA
EMA 7
EMA 8
EMA 10
EMA 11
Elution Volume (mL)
Gram Schmidt
b
0
5
10
15
20
25
30
35
MA wt. %
5
1 0
1 5
2 0
2 5
3 0
0
20
40
60
80
100
120
GS
MA
EMA 1
EMA 2
EMA 3
EMA 4
EMA 5
EMA 6
Elution Volume (mL)
Gram Schmidt
a
0
5
10
15
20
25
30
35
MA wt. %
0
5
10
15
20
25
30
0.0
0.5
1.0
1.5
2.0
2.5
MA content (NMR) (wt. %)
relative MA content (FTIR)
carbonyl group/ - CH
2
c
Fig. 3.20 Overlay of the results from HPLC-FTIR analysis of EMA 1–6 (a), EMA 7, 8, 10 and
11 (b) and the correlation between the MA content measured by
1
H-NMR and the peak area ratio
of the carbonyl group (1,730 cm
À1
) to the CH 2 group (1,450 cm
À1
) measured by FTIR (c)
(reprinted from [40] with permission of Wiley-VCH)
100
3 Column-Based Chromatographic Techniques
(EMA 7, 8, 10 and 11) with a broad CCD and the second one (EMA 1–6) with a
narrow CCD and a MA gradient of <5 wt%. Among these, EMA 3 and 4 show the
most homogeneous chemical composition of about 9 wt% and 13.2 wt% MA,
respectively, along the elution volume. In both sets of samples, copolymers with
a second elution peak between 4 mL and 5 mL, namely EMA 4 and 7, were
identified. The MA content in the second peak ranges between 1 wt% and 2.5 wt
% (EMA 7) and between 0 wt% and 2 wt% (EMA 4). The presence of PE
homopolymer in sample EMA 4 can be verified by FTIR spectra at selected elution
volumes. At an elution volume of 4 mL, no carbonyl absorption band was detected,
while in the FTIR spectrum at 5 mL the carbonyl absorption band was clearly
identified. Thus the PE fraction in EMA 4 is most likely to be a PE homopolymer.
After plotting the elution volume at the peak maximum as a function of the
calculated average MA content for samples EMA 1–6, a linear relationship between
elution volumes of 16 mL and 28 mL is obtained; see Fig. 3.21.
The elution behaviours of EMA 1 (23.5 wt%) and EMA 10 (24 wt%) are
different despite their similar average chemical compositions (Fig. 3.20a, b). This
can be attributed to their different CCDs and architectural differences (degree of
5
1 0
1 5
2 0
2 5
3 0
0
10
20
30
40
50
60
70
80
GS
MA
EMA 7
EMA 8
EMA 10
EMA 11
Elution Volume (mL)
Gram Schmidt
b
0
5
10
15
20
25
30
35
MA wt. %
5
1 0
1 5
2 0
2 5
3 0
0
20
40
60
80
100
120
GS
MA
EMA 1
EMA 2
EMA 3
EMA 4
EMA 5
EMA 6
Elution Volume (mL)
Gram Schmidt
a
0
5
10
15
20
25
30
35
MA wt. %
0
5
10
15
20
25
30
0.0
0.5
1.0
1.5
2.0
2.5
MA content (NMR) (wt. %)
relative MA content (FTIR)
carbonyl group/ - CH
2
c
Fig. 3.20 Overlay of the results from HPLC-FTIR analysis of EMA 1–6 (a), EMA 7, 8, 10 and
11 (b) and the correlation between the MA content measured by
1
H-NMR and the peak area ratio
of the carbonyl group (1,730 cm
À1
) to the CH 2 group (1,450 cm
À1
) measured by FTIR (c)
(reprinted from [40] with permission of Wiley-VCH)
100
3 Column-Based Chromatographic Techniques