

The additional peaks in EMA 4 (between 1.5 mL and 2.5 mL), EMA 7 and EMA
9 (between 2.5 mL and 3 mL) were close to the exclusion volume of the column
(V 0 ¼ 3.21 mL). These peaks indicate the presence of non-adsorbing species in
EMA 4 and weakly adsorbing species in EMA 7 and EMA 9.
As is known, the ELSD response is not strictly independent of the structure of
the analyte and depends upon several factors, namely constant instrument
parameters (flow rate, temperature, sample loop volume, etc.), the concentration
of the analyte and the composition of the mobile phase. The description of the
effects of these parameters (concentration, molar mass and chemical composition
of the analyte, as well as the composition of the mobile phase) on the detector
response is given for the gradient system decalin-cyclohexanone in [80]. The
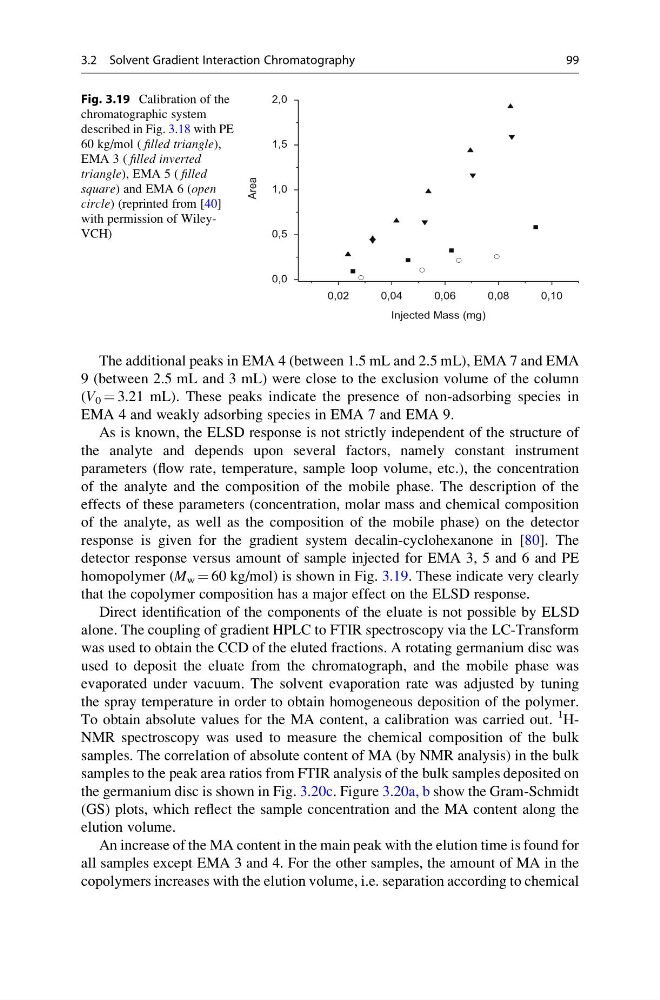
detector response versus amount of sample injected for EMA 3, 5 and 6 and PE
homopolymer (M w ¼ 60 kg/mol) is shown in Fig. 3.19. These indicate very clearly
that the copolymer composition has a major effect on the ELSD response.
Direct identification of the components of the eluate is not possible by ELSD
alone. The coupling of gradient HPLC to FTIR spectroscopy via the LC-Transform
was used to obtain the CCD of the eluted fractions. A rotating germanium disc was
used to deposit the eluate from the chromatograph, and the mobile phase was
evaporated under vacuum. The solvent evaporation rate was adjusted by tuning
the spray temperature in order to obtain homogeneous deposition of the polymer.
To obtain absolute values for the MA content, a calibration was carried out.
1 HNMR spectroscopy was used to measure the chemical composition of the bulk
samples. The correlation of absolute content of MA (by NMR analysis) in the bulk
samples to the peak area ratios from FTIR analysis of the bulk samples deposited on
the germanium disc is shown in Fig. 3.20c. Figure 3.20a, b show the Gram-Schmidt
(GS) plots, which reflect the sample concentration and the MA content along the
elution volume.
An increase of the MA content in the main peak with the elution time is found for
all samples except EMA 3 and 4. For the other samples, the amount of MA in the
copolymers increases with the elution volume, i.e. separation according to chemical
0,02
0,04
0,06
0,08
0,10
0,0
0,5
1,0
1,5
2,0
Area
Injected Mass (mg)
Fig. 3.19 Calibration of the
chromatographic system
described in Fig. 3.18 with PE
60 kg/mol ( filled triangle),
EMA 3 ( filled inverted
triangle), EMA 5 ( filled
square) and EMA 6 (open
circle) (reprinted from [40]
with permission of WileyVCH)
3.2 Solvent Gradient Interaction Chromatography
99
9 (between 2.5 mL and 3 mL) were close to the exclusion volume of the column
(V 0 ¼ 3.21 mL). These peaks indicate the presence of non-adsorbing species in
EMA 4 and weakly adsorbing species in EMA 7 and EMA 9.
As is known, the ELSD response is not strictly independent of the structure of
the analyte and depends upon several factors, namely constant instrument
parameters (flow rate, temperature, sample loop volume, etc.), the concentration
of the analyte and the composition of the mobile phase. The description of the
effects of these parameters (concentration, molar mass and chemical composition
of the analyte, as well as the composition of the mobile phase) on the detector
response is given for the gradient system decalin-cyclohexanone in [80]. The
detector response versus amount of sample injected for EMA 3, 5 and 6 and PE
homopolymer (M w ¼ 60 kg/mol) is shown in Fig. 3.19. These indicate very clearly
that the copolymer composition has a major effect on the ELSD response.
Direct identification of the components of the eluate is not possible by ELSD
alone. The coupling of gradient HPLC to FTIR spectroscopy via the LC-Transform
was used to obtain the CCD of the eluted fractions. A rotating germanium disc was
used to deposit the eluate from the chromatograph, and the mobile phase was
evaporated under vacuum. The solvent evaporation rate was adjusted by tuning
the spray temperature in order to obtain homogeneous deposition of the polymer.
To obtain absolute values for the MA content, a calibration was carried out.
1 HNMR spectroscopy was used to measure the chemical composition of the bulk
samples. The correlation of absolute content of MA (by NMR analysis) in the bulk
samples to the peak area ratios from FTIR analysis of the bulk samples deposited on
the germanium disc is shown in Fig. 3.20c. Figure 3.20a, b show the Gram-Schmidt
(GS) plots, which reflect the sample concentration and the MA content along the
elution volume.
An increase of the MA content in the main peak with the elution time is found for
all samples except EMA 3 and 4. For the other samples, the amount of MA in the
copolymers increases with the elution volume, i.e. separation according to chemical
0,02
0,04
0,06
0,08
0,10
0,0
0,5
1,0
1,5
2,0
Area
Injected Mass (mg)
Fig. 3.19 Calibration of the
chromatographic system
described in Fig. 3.18 with PE
60 kg/mol ( filled triangle),
EMA 3 ( filled inverted
triangle), EMA 5 ( filled
square) and EMA 6 (open
circle) (reprinted from [40]
with permission of WileyVCH)
3.2 Solvent Gradient Interaction Chromatography
99