

3.2.1.5 Measurement and Evaluation
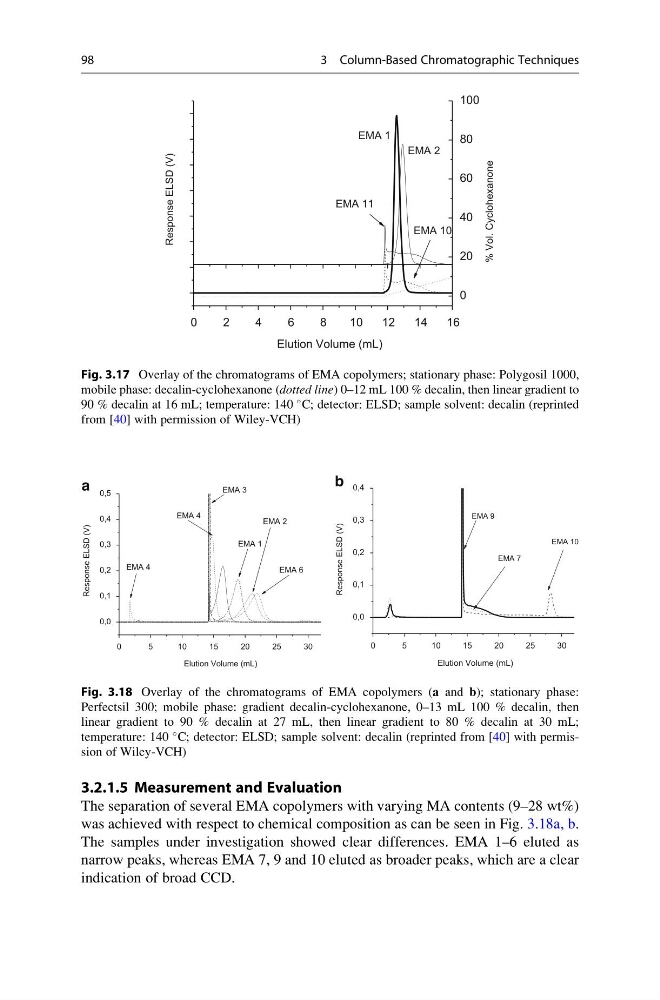
The separation of several EMA copolymers with varying MA contents (9–28 wt%)
was achieved with respect to chemical composition as can be seen in Fig. 3.18a, b.
The samples under investigation showed clear differences. EMA 1–6 eluted as
narrow peaks, whereas EMA 7, 9 and 10 eluted as broader peaks, which are a clear
indication of broad CCD.
0
2
4
6
8
10
12
14
16
0
20
40
60
80
100
EMA 11
EMA 10
EMA 2
Response ELSD (V)
Elution Volume (mL)
EMA 1
% Vol. Cyclohexanone
Fig. 3.17 Overlay of the chromatograms of EMA copolymers; stationary phase: Polygosil 1000,
mobile phase: decalin-cyclohexanone (dotted line) 0–12 mL 100 % decalin, then linear gradient to
90 % decalin at 16 mL; temperature: 140
C; detector: ELSD; sample solvent: decalin (reprinted
from [40] with permission of Wiley-VCH)
0
5
10
15
20
25
30
0,0
0,1
0,2
0,3
0,4
0,5
Response ELSD (V)
Elution Volume (mL)
EMA 6
EMA 2
EMA 1
EMA 4
EMA 4
EMA 3
a
0
5
10
15
20
25
30
0,0
0,1
0,2
0,3
0,4
Response ELSD (V)
Elution Volume (mL)
EMA 7
EMA 9
EMA 10
b
Fig. 3.18 Overlay of the chromatograms of EMA copolymers (a and b); stationary phase:
Perfectsil 300; mobile phase: gradient decalin-cyclohexanone, 0–13 mL 100 % decalin, then
linear gradient to 90 % decalin at 27 mL, then linear gradient to 80 % decalin at 30 mL;
temperature: 140
C; detector: ELSD; sample solvent: decalin (reprinted from [40] with permission of Wiley-VCH)
98
3 Column-Based Chromatographic Techniques
The separation of several EMA copolymers with varying MA contents (9–28 wt%)
was achieved with respect to chemical composition as can be seen in Fig. 3.18a, b.
The samples under investigation showed clear differences. EMA 1–6 eluted as
narrow peaks, whereas EMA 7, 9 and 10 eluted as broader peaks, which are a clear
indication of broad CCD.
0
2
4
6
8
10
12
14
16
0
20
40
60
80
100
EMA 11
EMA 10
EMA 2
Response ELSD (V)
Elution Volume (mL)
EMA 1
% Vol. Cyclohexanone
Fig. 3.17 Overlay of the chromatograms of EMA copolymers; stationary phase: Polygosil 1000,
mobile phase: decalin-cyclohexanone (dotted line) 0–12 mL 100 % decalin, then linear gradient to
90 % decalin at 16 mL; temperature: 140
C; detector: ELSD; sample solvent: decalin (reprinted
from [40] with permission of Wiley-VCH)
0
5
10
15
20
25
30
0,0
0,1
0,2
0,3
0,4
0,5
Response ELSD (V)
Elution Volume (mL)
EMA 6
EMA 2
EMA 1
EMA 4
EMA 4
EMA 3
a
0
5
10
15
20
25
30
0,0
0,1
0,2
0,3
0,4
Response ELSD (V)
Elution Volume (mL)
EMA 7
EMA 9
EMA 10
b
Fig. 3.18 Overlay of the chromatograms of EMA copolymers (a and b); stationary phase:
Perfectsil 300; mobile phase: gradient decalin-cyclohexanone, 0–13 mL 100 % decalin, then
linear gradient to 90 % decalin at 27 mL, then linear gradient to 80 % decalin at 30 mL;
temperature: 140
C; detector: ELSD; sample solvent: decalin (reprinted from [40] with permission of Wiley-VCH)
98
3 Column-Based Chromatographic Techniques