

3.11.1 The
Trichothiodystrophy Group
A Protein (TTD-A or p8)
1. Desalt 20 μL of recombinant p8 [28] at 24 μM as explained in
Subheading 3.1.
2. Connect the TriVersa Nanomate™ to the Q-Exactive™ Biopharma Orbitrap as explained in Subheading 3.3.
3. In Excalibur Tune window, manually set the following
parameters:
Operate the instrument in positive mode with an m/z
range from 200 to 4,000.
4. Intact protein mode: off; HRM mode: off; resolution:
120,000; Micro Scan Count: 1; Max. Ion Time: 100 ms;
AGC target: 1e6, S-Lens RF Level: 40, Capillary Temperature:
275
C, Capillary Voltage: 1.5 kV.
5. Save these parameters as an .mstune file.
Start a 2 min acquisition in the 200–4000 m/z range and
analyze data.
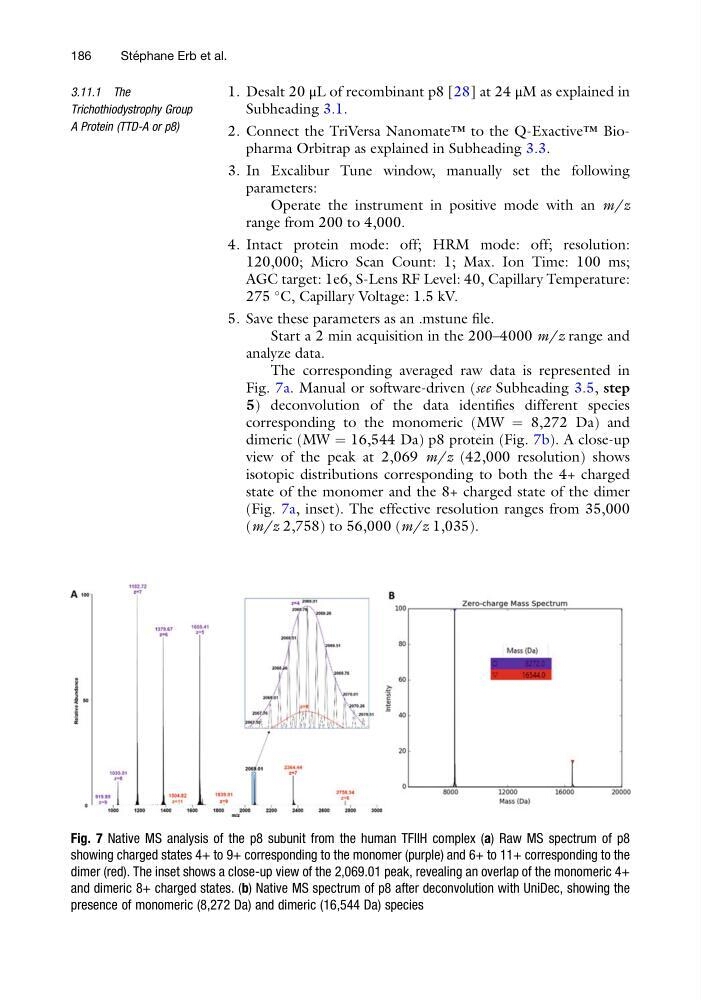
The corresponding averaged raw data is represented in
Fig. 7a. Manual or software-driven (see Subheading 3.5, step
5) deconvolution of the data identifies different species
corresponding to the monomeric (MW ¼ 8,272 Da) and
dimeric (MW ¼ 16,544 Da) p8 protein (Fig. 7b). A close-up
view of the peak at 2,069 m/z (42,000 resolution) shows
isotopic distributions corresponding to both the 4+ charged
state of the monomer and the 8+ charged state of the dimer
(Fig. 7a, inset). The effective resolution ranges from 35,000
(m/z 2,758) to 56,000 (m/z 1,035).
Fig. 7 Native MS analysis of the p8 subunit from the human TFIIH complex (a) Raw MS spectrum of p8
showing charged states 4+ to 9+ corresponding to the monomer (purple) and 6+ to 11+ corresponding to the
dimer (red). The inset shows a close-up view of the 2,069.01 peak, revealing an overlap of the monomeric 4+
and dimeric 8+ charged states. (b) Native MS spectrum of p8 after deconvolution with UniDec, showing the
presence of monomeric (8,272 Da) and dimeric (16,544 Da) species
186
Ste ´ phane Erb et al.
Trichothiodystrophy Group
A Protein (TTD-A or p8)
1. Desalt 20 μL of recombinant p8 [28] at 24 μM as explained in
Subheading 3.1.
2. Connect the TriVersa Nanomate™ to the Q-Exactive™ Biopharma Orbitrap as explained in Subheading 3.3.
3. In Excalibur Tune window, manually set the following
parameters:
Operate the instrument in positive mode with an m/z
range from 200 to 4,000.
4. Intact protein mode: off; HRM mode: off; resolution:
120,000; Micro Scan Count: 1; Max. Ion Time: 100 ms;
AGC target: 1e6, S-Lens RF Level: 40, Capillary Temperature:
275
C, Capillary Voltage: 1.5 kV.
5. Save these parameters as an .mstune file.
Start a 2 min acquisition in the 200–4000 m/z range and
analyze data.
The corresponding averaged raw data is represented in
Fig. 7a. Manual or software-driven (see Subheading 3.5, step
5) deconvolution of the data identifies different species
corresponding to the monomeric (MW ¼ 8,272 Da) and
dimeric (MW ¼ 16,544 Da) p8 protein (Fig. 7b). A close-up
view of the peak at 2,069 m/z (42,000 resolution) shows
isotopic distributions corresponding to both the 4+ charged
state of the monomer and the 8+ charged state of the dimer
(Fig. 7a, inset). The effective resolution ranges from 35,000
(m/z 2,758) to 56,000 (m/z 1,035).
Fig. 7 Native MS analysis of the p8 subunit from the human TFIIH complex (a) Raw MS spectrum of p8
showing charged states 4+ to 9+ corresponding to the monomer (purple) and 6+ to 11+ corresponding to the
dimer (red). The inset shows a close-up view of the 2,069.01 peak, revealing an overlap of the monomeric 4+
and dimeric 8+ charged states. (b) Native MS spectrum of p8 after deconvolution with UniDec, showing the
presence of monomeric (8,272 Da) and dimeric (16,544 Da) species
186
Ste ´ phane Erb et al.